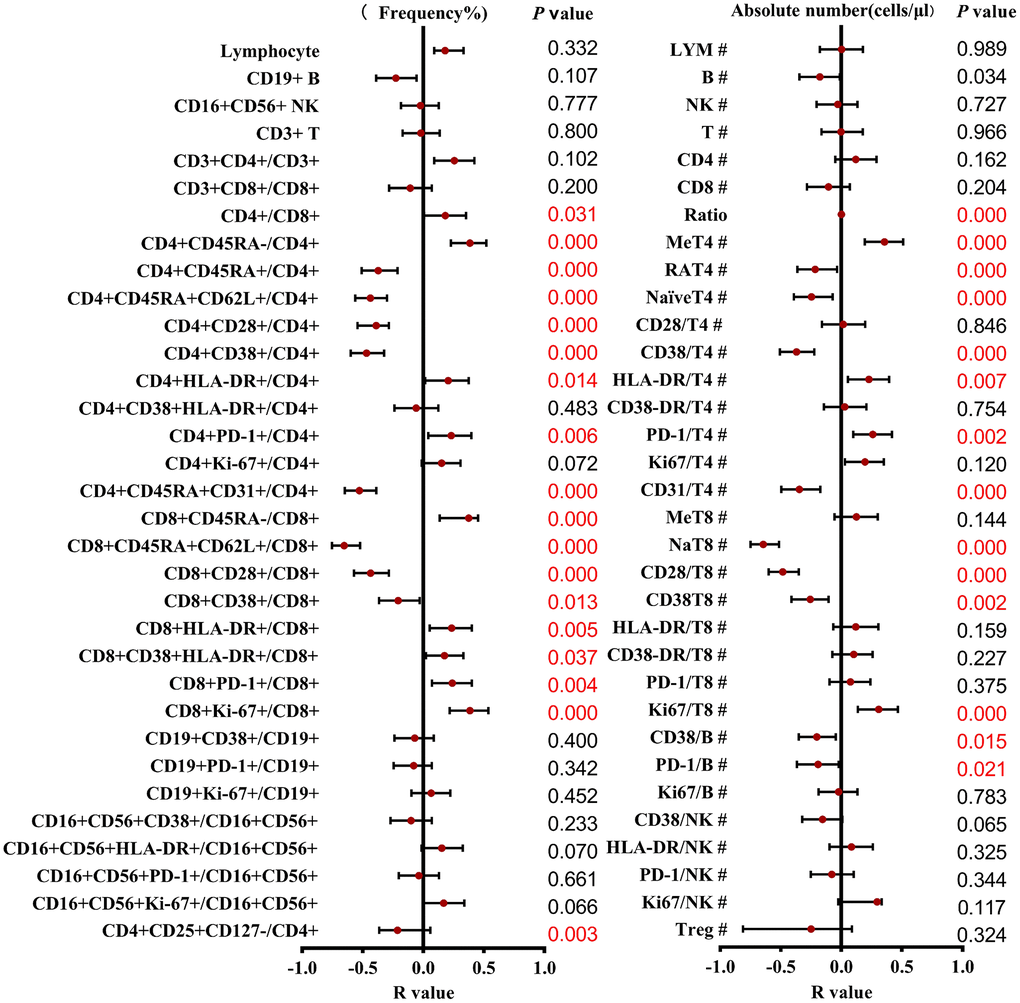
Figure 2.Correlation and regression analysis of different T cell subsets and ages were calculated. The left represents the frequency, and the right represents the absolute number. The red points and bars represent the R-value and 95% confidence interval of the regression equation, and the P-value to the right of the figure indicates the statistical significance of each subset.