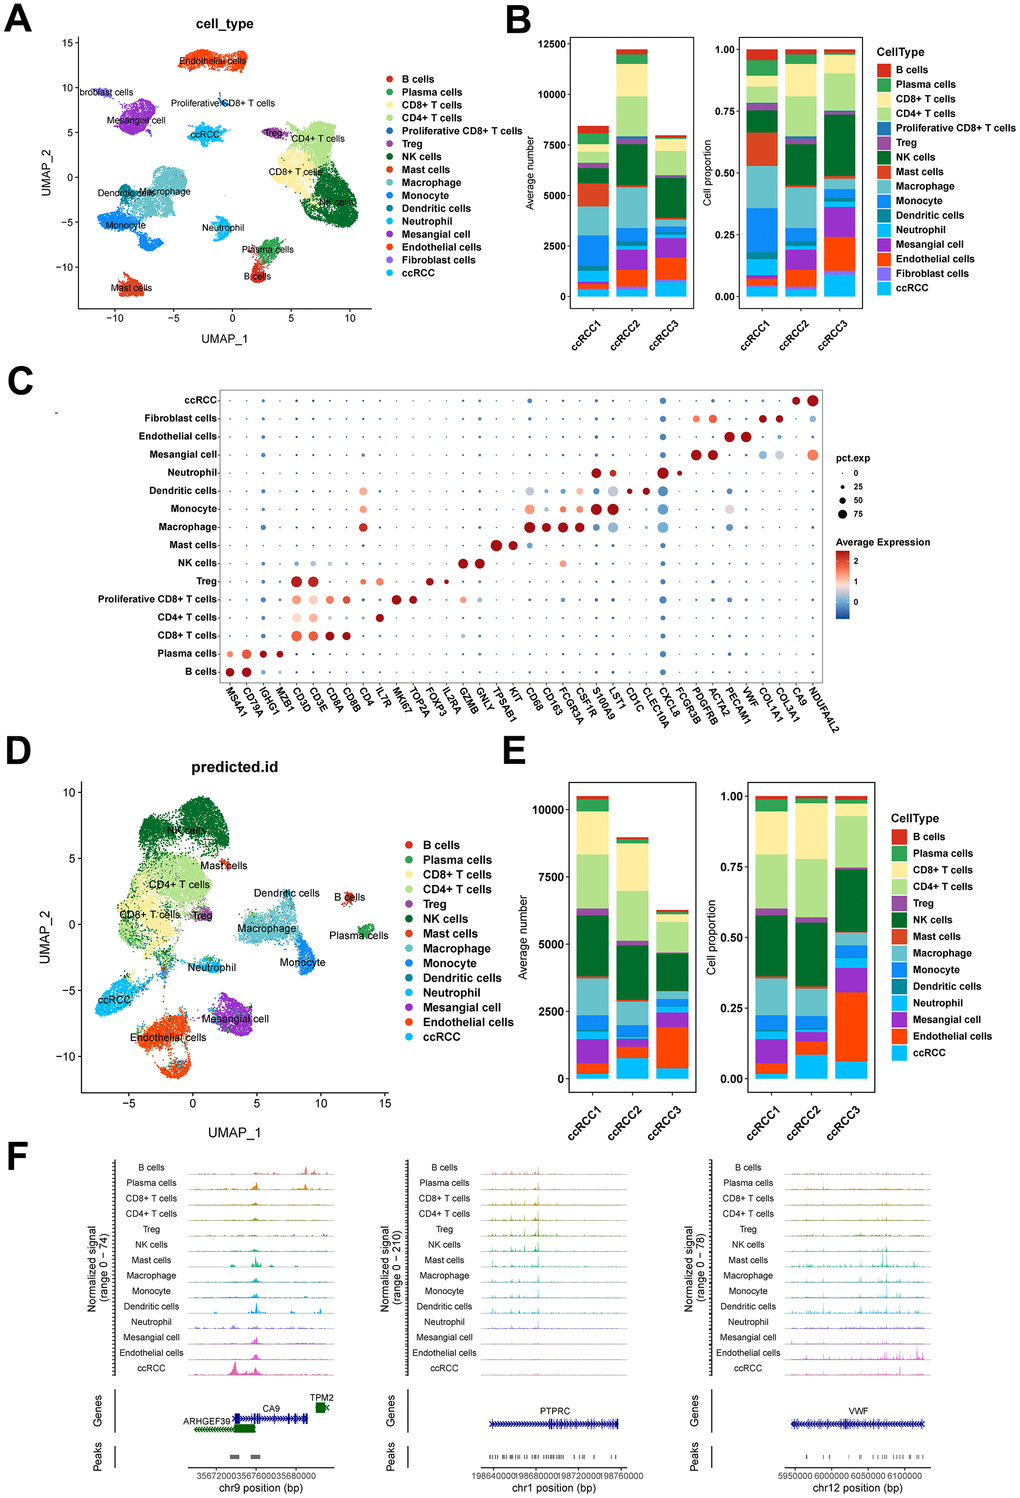
Figure 2.Single-cell transcriptome and epigenome profiles of ccRCC. (A) UMAP embedding of cells from scRNA-seq data. (B) Bar plots showing the number and fraction of each cell type in different samples in scRNA-seq data. (C) Dot plot displaying the expression patterns of marker genes for each cell type in scRNA-seq data. (D) UMAP embedding of cells from scATAC-seq data. (E) Bar plots showing the number and fraction of each cell type in different samples in scATAC-seq data. (F) Chromatin accessibility profiles of marker genes for each cell type in scATAC-seq data.