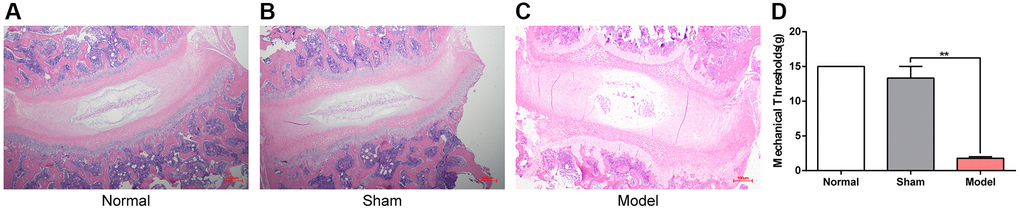
Figure 1.Histomorphology of the cervical intervertebral disc and the neck-skin response thresholds to the mechanical stimuli 12 weeks after modeling. (A–C) H&E staining of cervical intervertebral disc in different groups 12 weeks after modeling, note: Scale bar = 100 µm. (D) The neck-skin response thresholds to the mechanical stimuli applied by von Frey filaments in different groups 12 weeks after modeling, note: values are means ± SEMs, n = 3 per group, **p < 0.01.