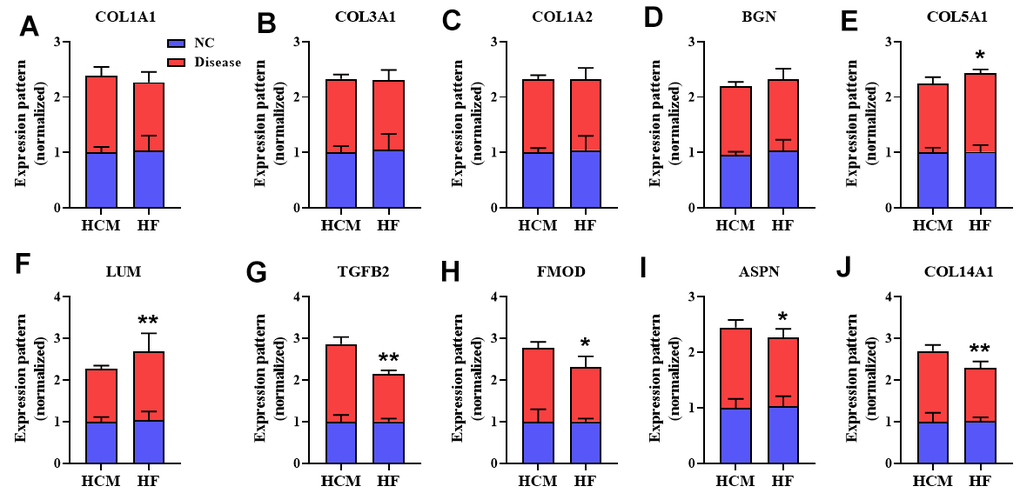
Figure 8.The overlap genes expression pattern in HCM and HF datasets. The expression pattern of COL1A1 (A), COL3A1 (B), COL1A2 (C), BGN (D), COL5A1 (E), and LUM (F), TGFB2 (G), FMOD (H), ASPN (I), COL14A1 (J) in different datasets. Values were normalized to NC group and represented as Mean ± SD (n = 3 in HCM dataset, n = 13 in HF dataset). *P < 0.05, **P< 0.01 vs. HCM disease group.