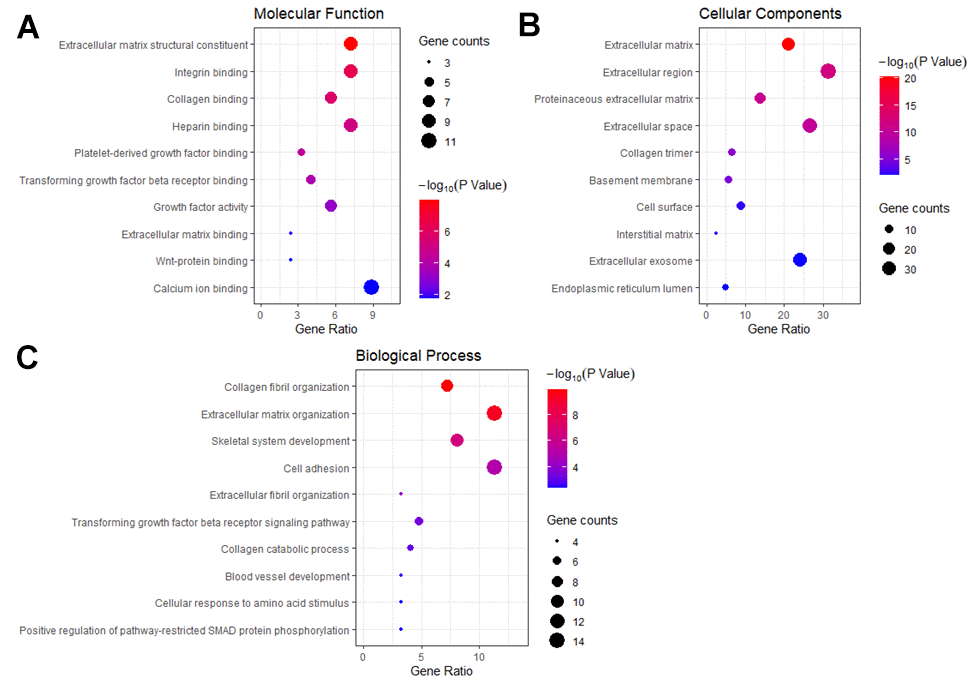
Figure 5.GO enrichment analysis of HCM and HF overlap genes. (A) The plot of enriched molecular functions. (B) The plot of enriched cellular components. (C) The plot of enriched biological processes. The number of genes enriched in each GO term was shown as the circle size, and the p-value was shown as different colors.