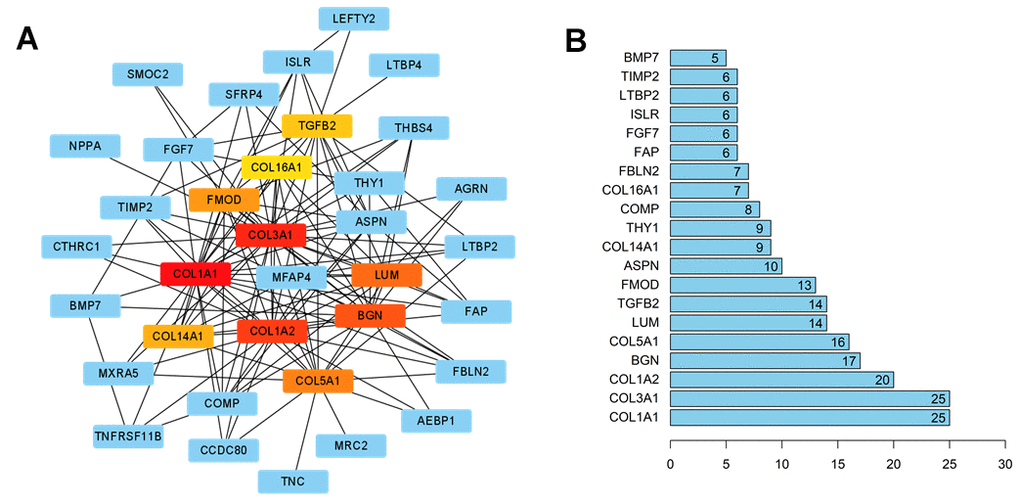
Figure 4.The interaction network of HCM and HF overlap genes. (A) PPI network of the overlap genes. The hub genes were represented as red and yellow nodes. A deeper red color indicated more connections. (B) Bar plot of the number of hub gene links.
Figure 4 — Identification of differentially expressed genes to predict the risk of heart failure in older patients with hypertrophic cardiomyopathy | Aging