Submit an Article
Navigate
Home
Editorial Board
Editorial Policies
Current Volume
Archive
Scientific Integrity
Publication Ethics Statements
Interviews with Outstanding Authors
Newsroom
Sponsored Conferences
Podcast
Contact
Special Collections
Submit an Article
Online ISSN: 1945-4589
Research Paper
|
Volume 16, Issue 13
|
pp. 10860–10867
Identification of differentially expressed genes to predict the risk of heart failure in older patients with hypertrophic cardiomyopathy
Back to article
Figure 3
(3 of 8)
−
100%
+
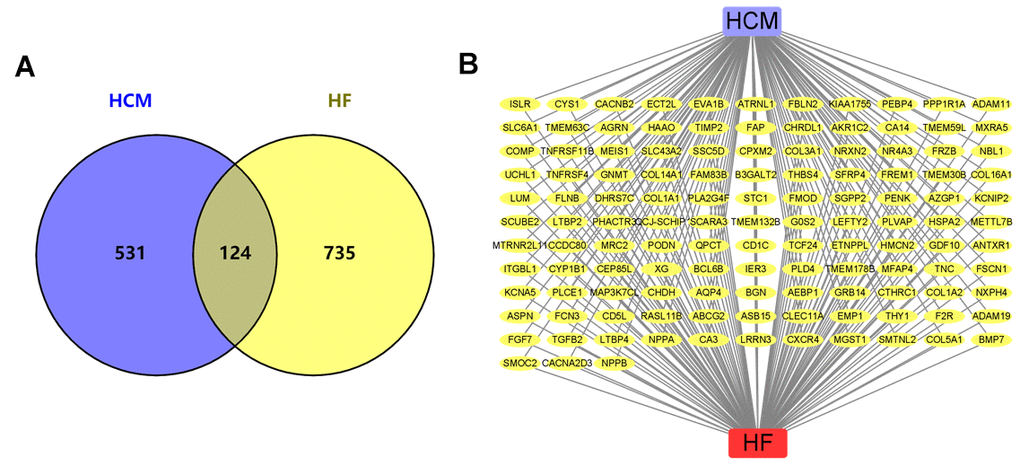
Figure 3.
HCM and HF datasets overlap DEGs.
(
A
) Venn diagram of HCM and HF DEGs. (
B
) The network of HCM, HF, and all the overlap DEGs. Yellow nodes represented the overlap DEGs.