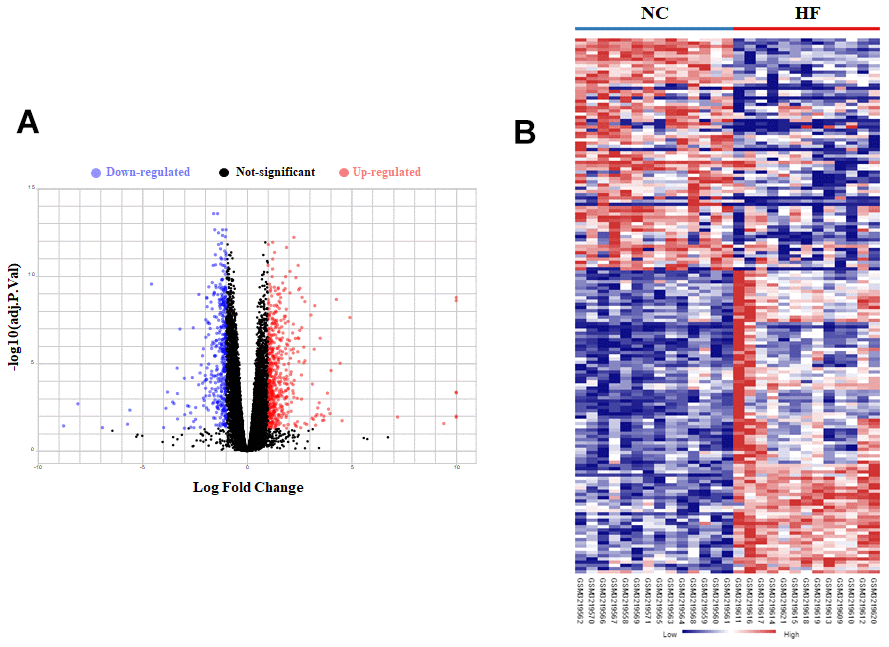
Figure 2.Bioinformatic analysis of DEGs in LV tissue of normal control (NC) and heart failure (HF) patients. (A) The volcano plot of DEGs in LV tissue between NC group and HF group. (B) Heatmaps of DEGs in LV tissue of NC group and HF group. Red color indicated high expression while blue color indicated low expression.