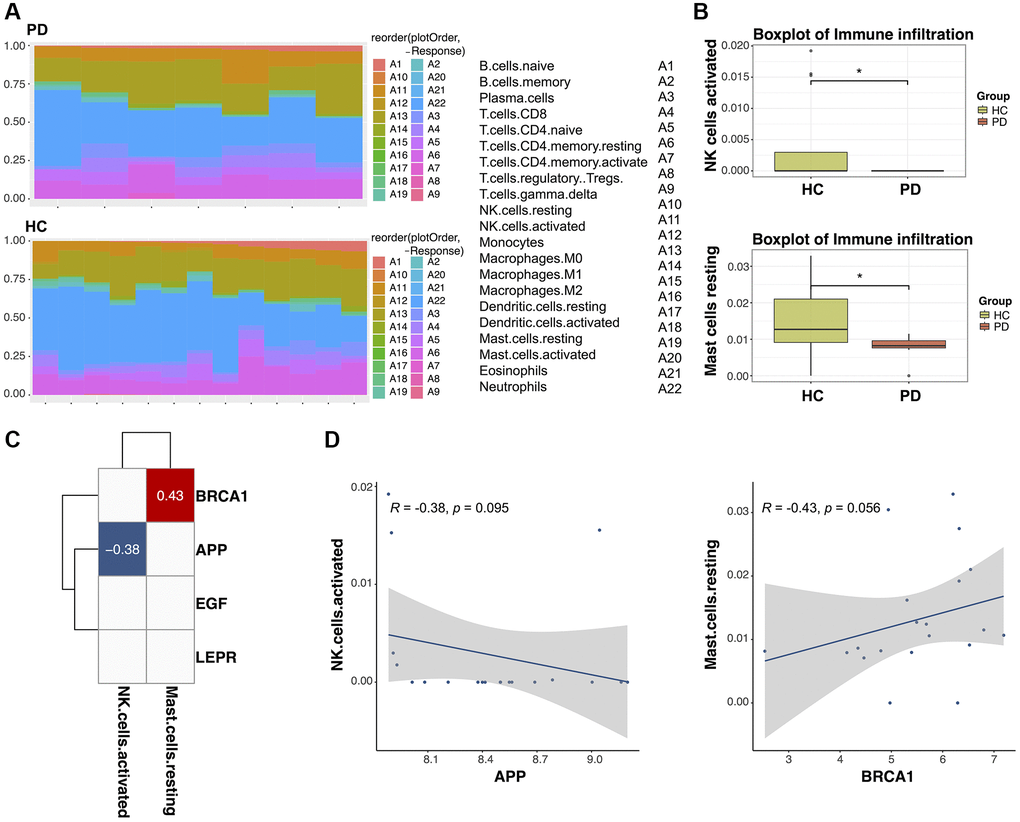
Figure 9.The relationship between diagnostic biomarkers and immune cell infiltration. (A) Heatmap of the infiltration proportions of 22 types of immune cells in Parkinson’s disease (PD) patients and healthy control (HC) subjects. (B) Box plots for the differential proportion analysis of two immune cell types in PD and HC samples. (C) Heatmap of the correlation between diagnostic biomarkers and immune cells. (D) Correlation between APP expression and activated natural killer (NK) cells and correlation between BRCA1 expression and resting mast cells.