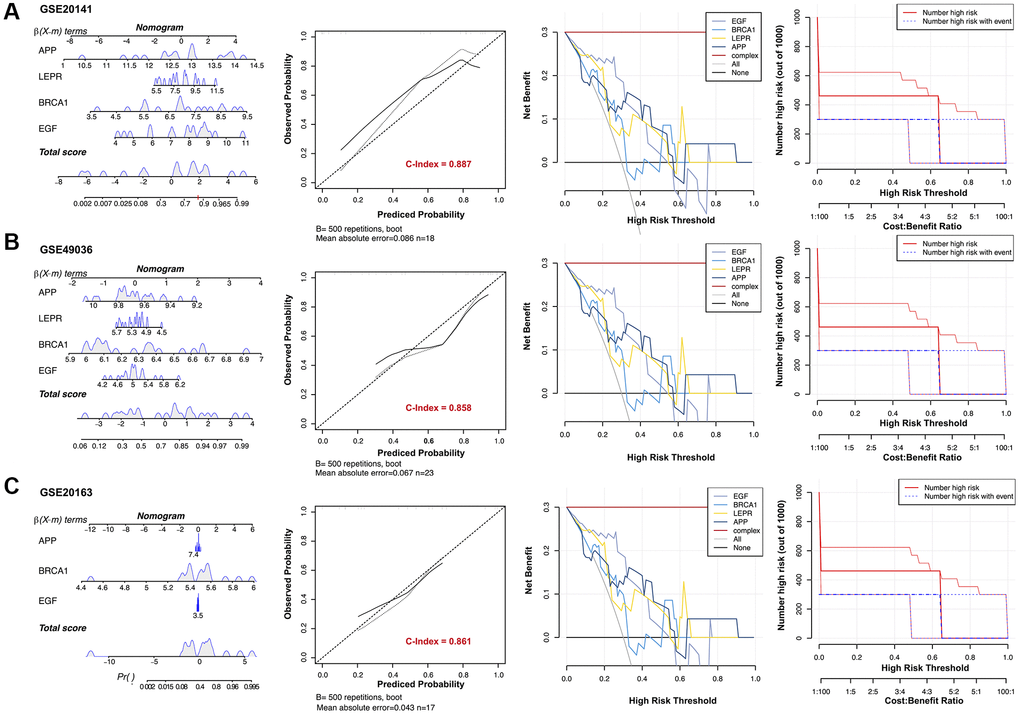
Figure 7.Establishment of the diagnostic model in three validation datasets. Nomograms for the diagnostic model of Parkinson’s disease (PD), calibration curves, and decision curve analyses (DCAs) for the diagnostic model were constructed in (A) GSE20141, (B) GSE49036, and (C) GSE20163.