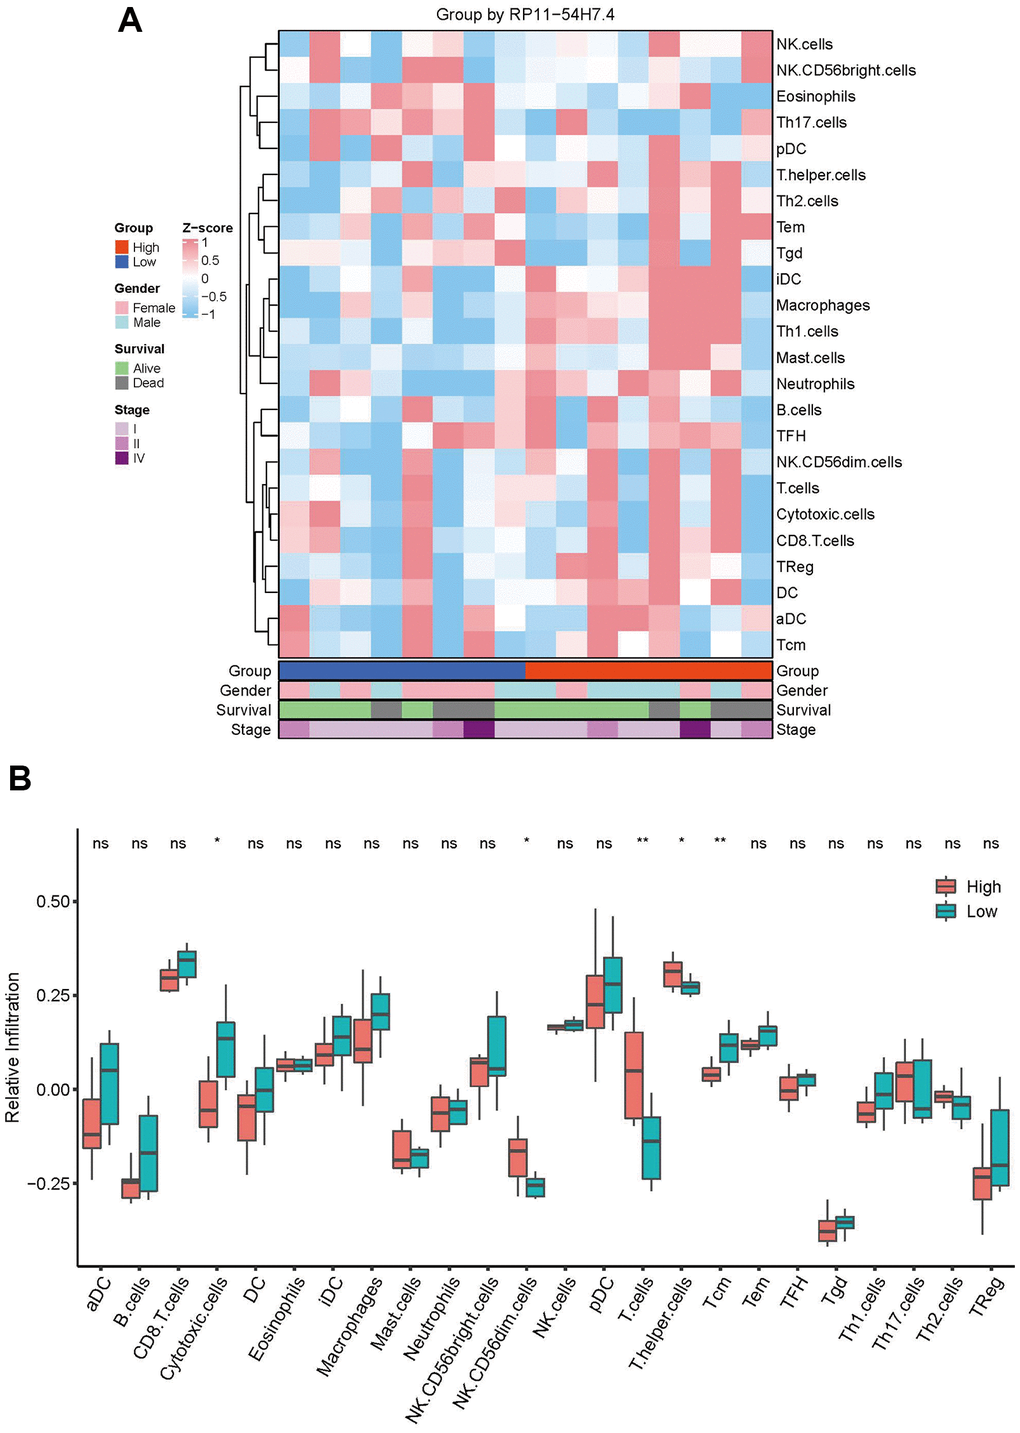
Figure 3.Correlation between immune cell infiltration and AL161431.1 expression. (A) Infiltration abundance of 24 immune cells in CCA samples was calculated by ssGSEA algorithm and transformed the sample-expression matrix into a sample-immune cell score matrix. (B) The abundance of 24 immune infiltrates in the high- AL161431.1 Expression and low- AL161431.1 Expression groups was compared by t-test. nsp ≥ 0.05, *p < 0.05, **p < 0.01.