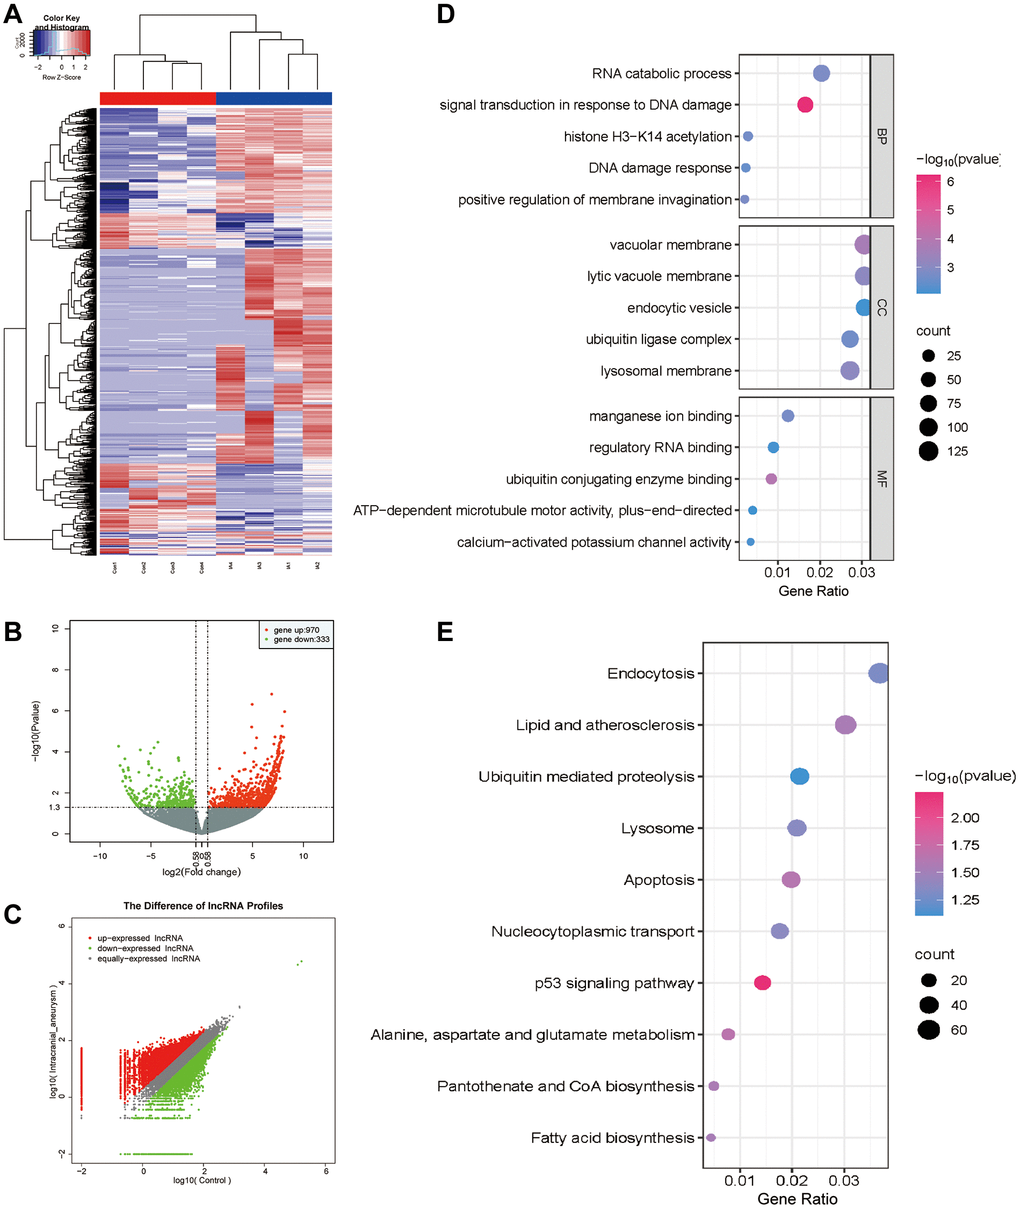
Figure 3.DE analysis of exo-LncRNAs and functional enrichment analysis. (A) The DE LncRNAs in exosomes obtained from patients with IA and the control group. The upregulated and downregulated LncRNAs are shown in red and blue, respectively. (B) Volcano plot of the DE LncRNAs. (C) Scatter plot of the DE LncRNAs. (D) GO bubble plot of DE LncRNAs target genes. (E) KEGG bubble plot of DE LncRNAs target genes.