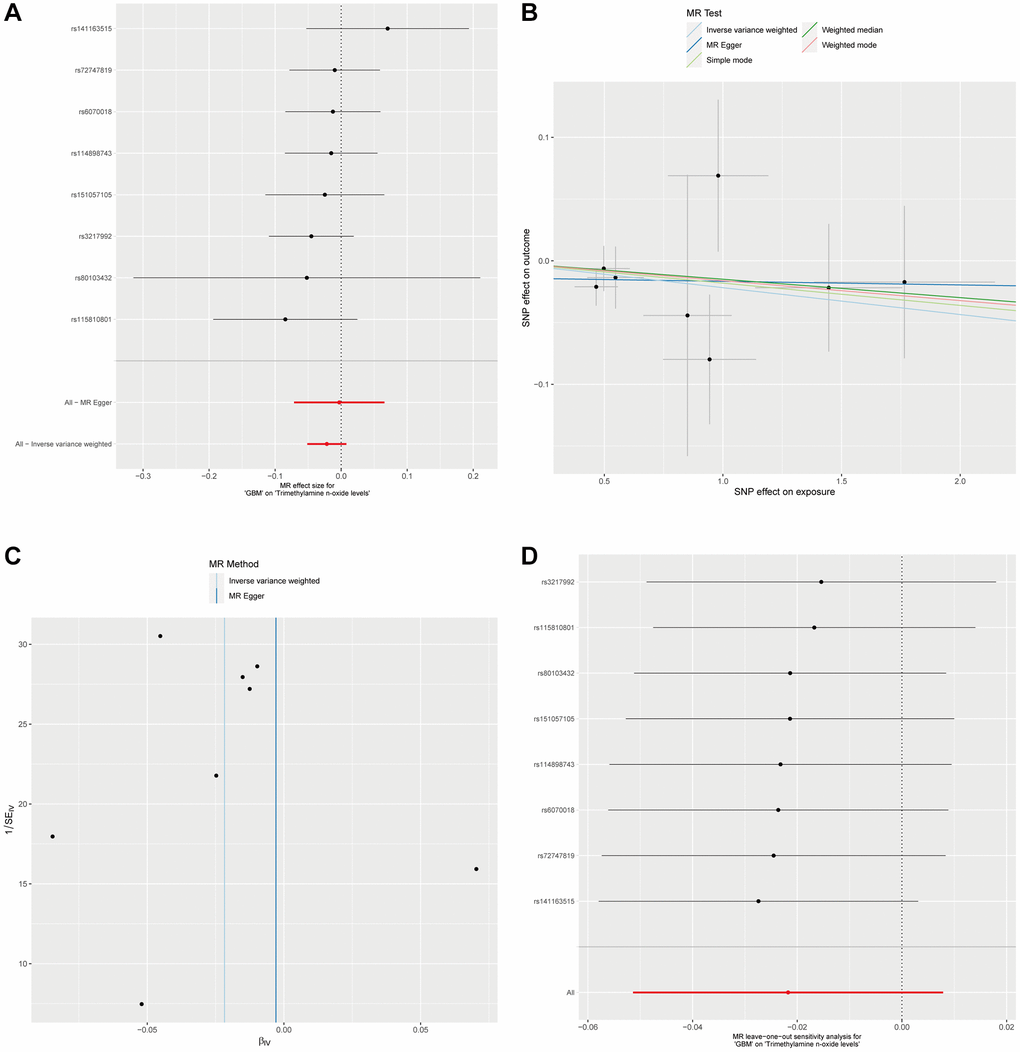
Figure 3.Analysis of GBM Impact on plasma Trimethylamine N-oxide levels via reverse MR. (A). Forest plot for the reverse MR analysis of GBM’s effect on Trimethylamine N-oxide levels. (B) This scatter plot maps the SNP effects on GBM against their effects on plasma Trimethylamine N-oxide levels, applying various MR methods. (C) Displayed is the MR-Egger intercept test for the reverse MR analysis. The proximity of the intercept to the zero line and the lack of deviation indicates no evidence of horizontal pleiotropy in the analysis. (D) The leave-one-out sensitivity analysis for the reverse MR is shown here, demonstrating the effect size stability when each SNP is sequentially excluded.