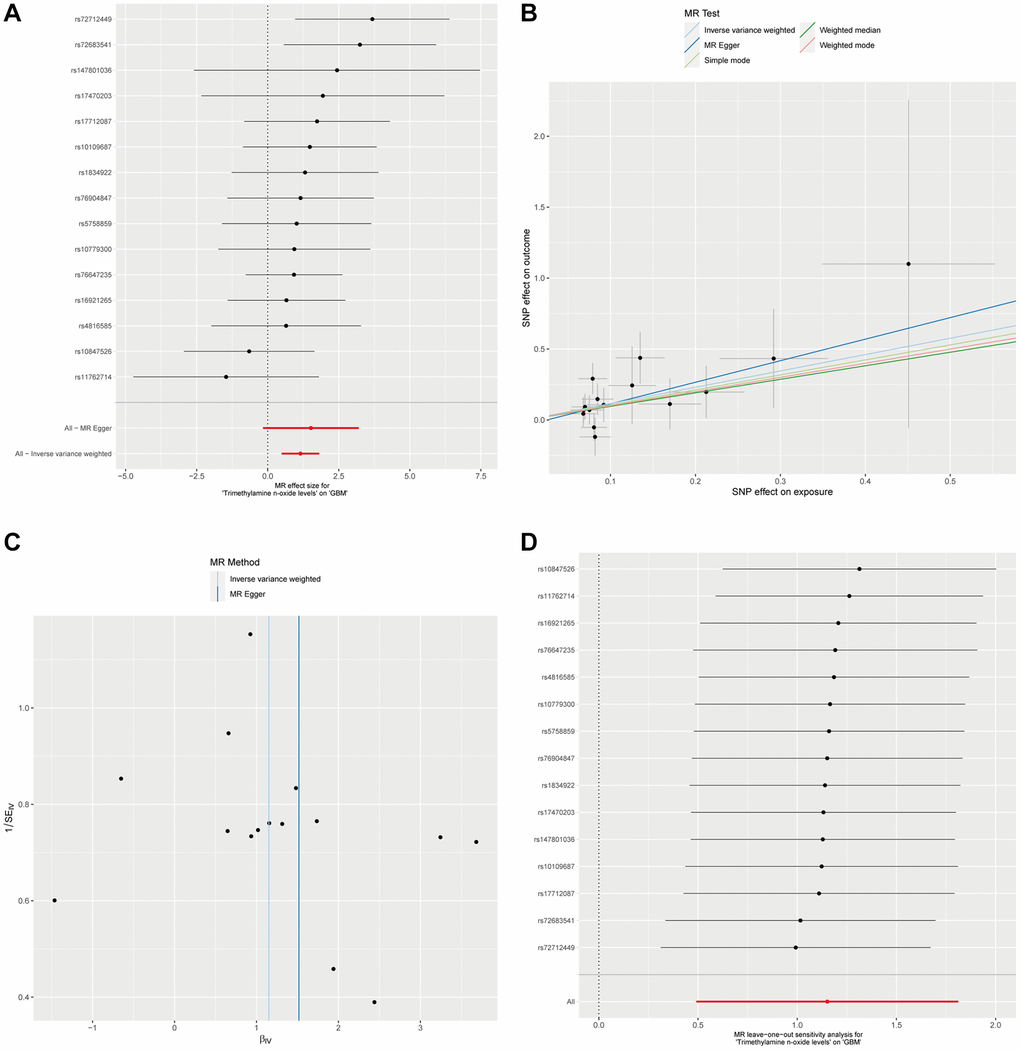
Figure 2.The causal association between plasma Trimethylamine N-oxide and GBM. (A). Forest plot illustrating ORs and 95% CIs for the association, with individual SNPs represented by black squares and their CIs by horizontal lines; the pooled OR is indicated by a red line. (B) Scatter plot showing SNP effects on TMAO levels versus GBM risk, with lines for different MR methods showing the causal relationship’s direction and strength. (C) MR-Egger intercept test assessing horizontal pleiotropy, where the x-axis intercept value indicates pleiotropy presence, and the I² statistic on the y-axis shows instrumental variable heterogeneity; a vertical blue line shows the null intercept, suggesting no pleiotropy. (D) Leave-one-out sensitivity analysis indicating the stability of the causal estimate across SNPs, with a consistent overall estimate shown by a red line, suggesting no individual SNP significantly alters the MR estimate.