Submit an Article
Navigate
Home
Editorial Board
Editorial Policies
Current Volume
Archive
Scientific Integrity
Publication Ethics Statements
Interviews with Outstanding Authors
Newsroom
Sponsored Conferences
Podcast
Contact
Special Collections
Submit an Article
Online ISSN: 1945-4589
Research Paper
|
Volume 16, Issue 9
|
pp. 8260–8278
HLA-B and TIMP1 as hub genes of the ventricular remodeling caused by hypertension
Back to article
Figure 5
(5 of 7)
−
100%
+
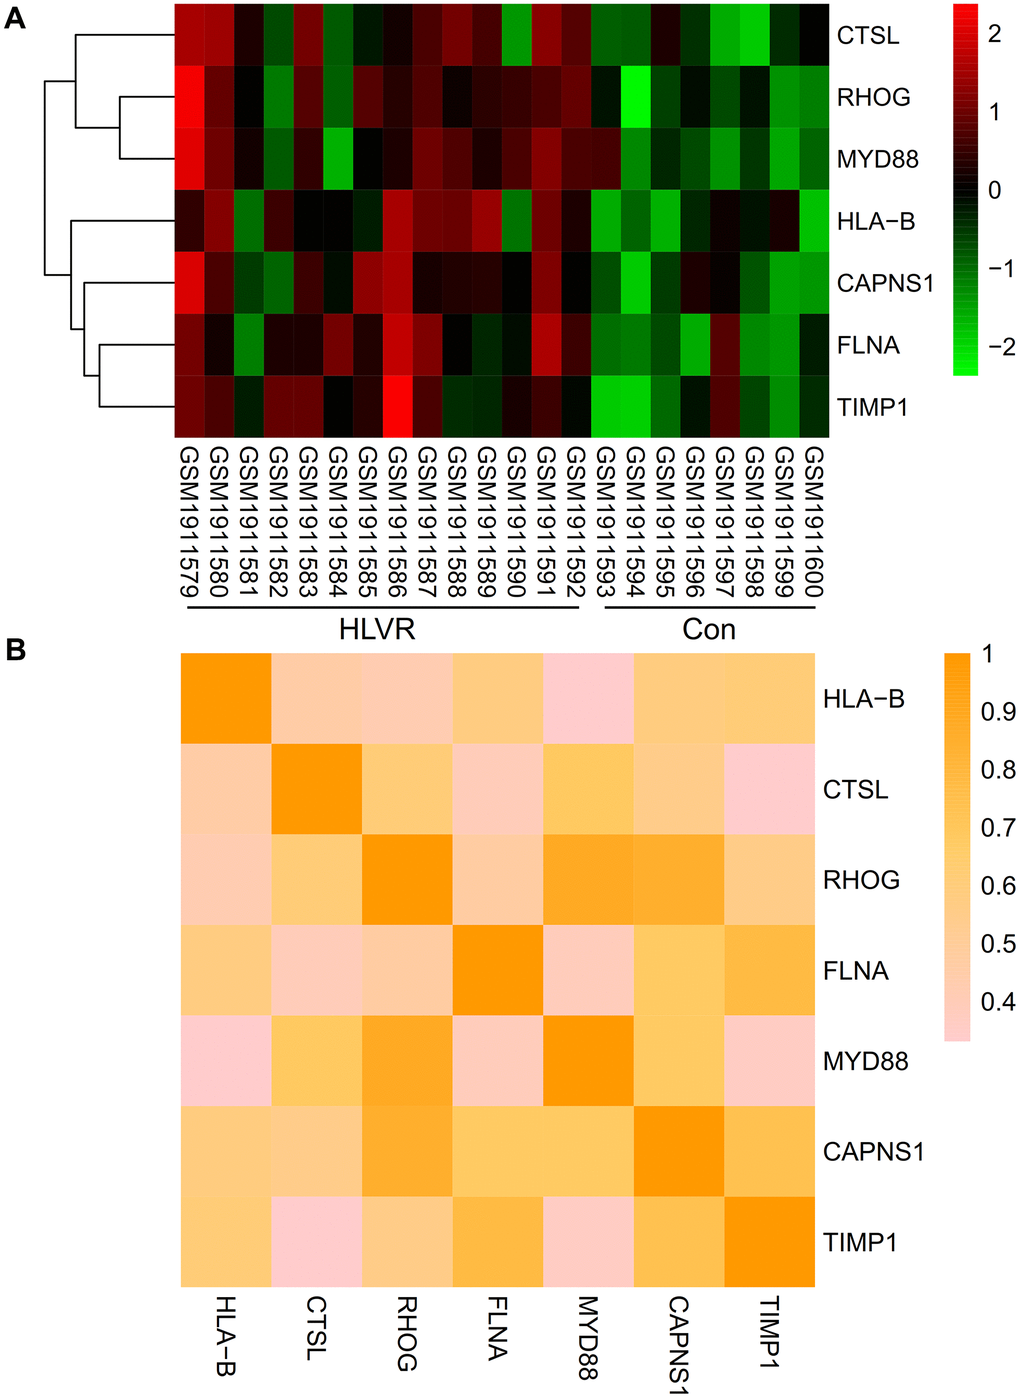
Figure 5.
Expression and correlation analysis of significant hub genes.
(
A
) A heatmap showing the expression level of significant hub genes in the GSE74144 dataset. (
B
) Correlations among all the significant hub genes.