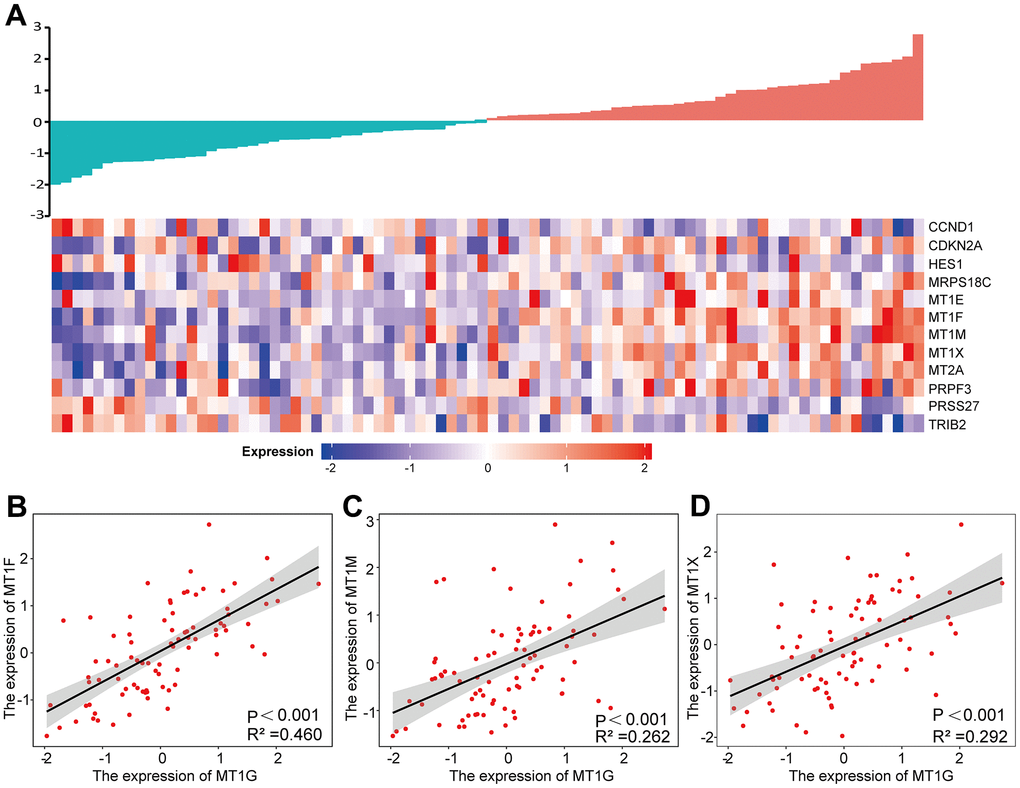
Figure 8.Expression analysis of MT1G-related genes. (A) A gene expression-related heatmap of the 12 common DEGs between GEO and TARGET datasets. (B–D) Expression correlations between MT1F, MT1M and MT1X and MT1G were shown as scatter plots. p <0.05 was set for significance.