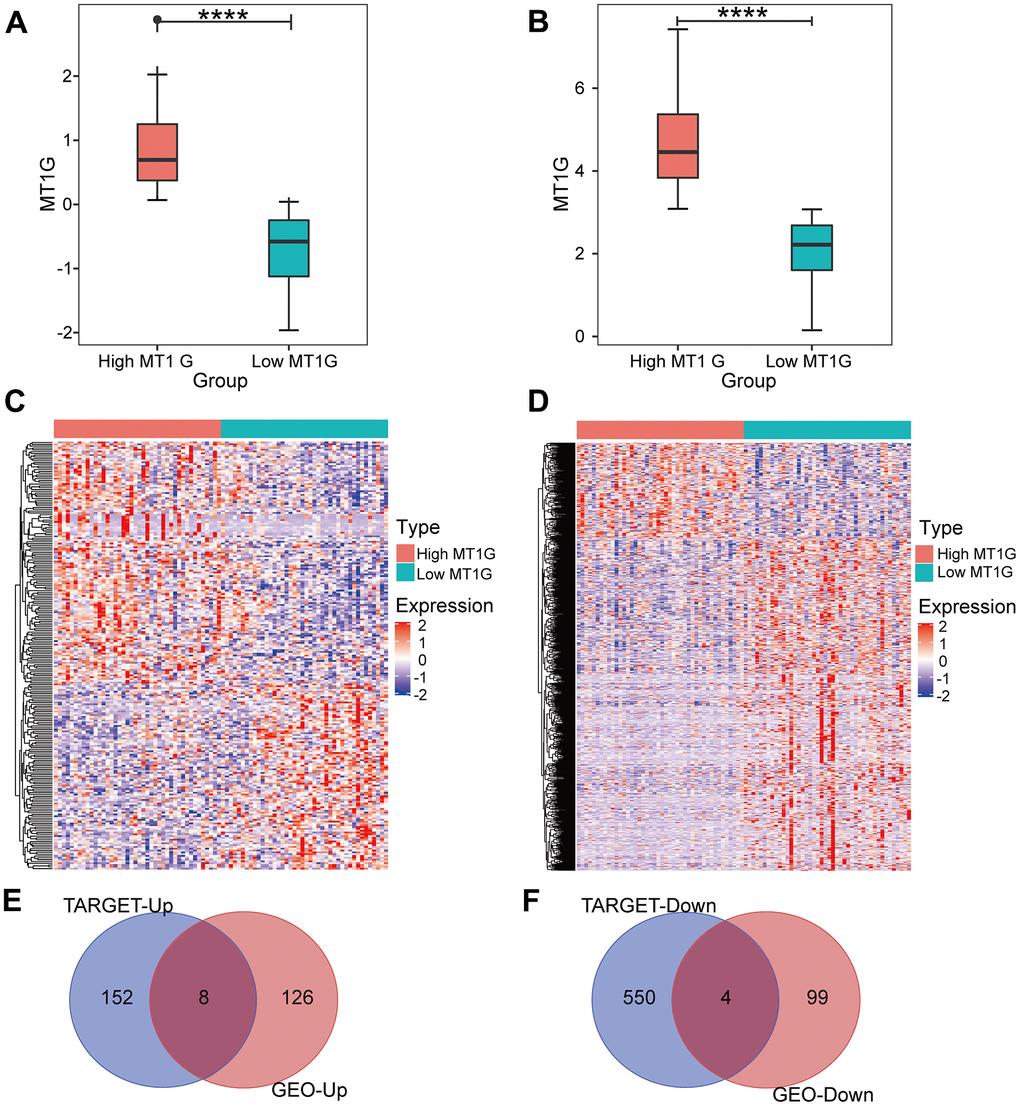
Figure 3.Expression analysis for MT1G and coexpressed genes. (A) MT1G expression in the GSE33382 cohort. (B) MT1G expression in the TARGET cohort. (C) The median expression level of MT1G in OS samples in the GSE33382 data set was used to divide patients into high/low expression groups, and the significant DEGs between the two groups were displayed in the form of a heatmap. (D) The median MT1G expression value of OS samples in the TARGET data set was used to sort the patients into high/low expression groups, and the significant DEGs between the two groups were displayed in the form of a heatmap. (E) Venn diagram of the intersection of upregulated DEGs in the GEO and TARGET datasets. (F) Venn diagram of the intersection of downregulated DEGs in the GEO and TARGET datasets. (ns, p >0.05; *p <0.05; **p <0.01; ***p <0.001).