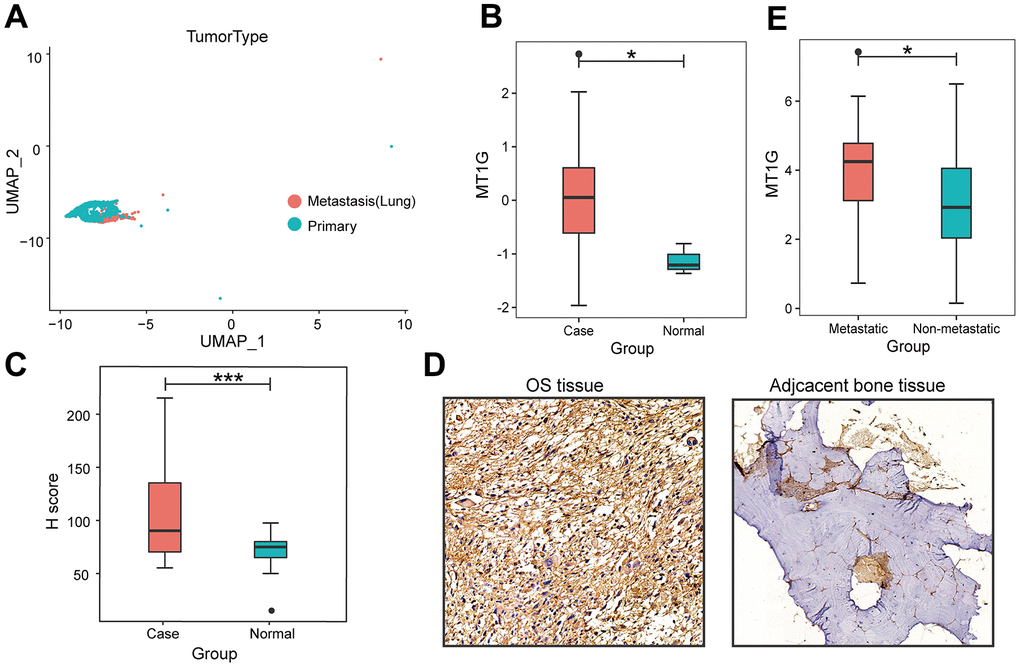
Figure 2.Characterization of single-cell RNA-seq profiles. (A) The clustering result of 2011 MSCs using the UMAP nonlinear dimensional reduction method colored by tissue origin. (B) MT1G was obviously more highly expressed in tumor tissues than in normal tissues. (C) In contrast to the primary tumor tissues, MT1G was obviously more highly expressed in metastatic tumor tissues. (D) Quantification of MT1G IHC staining in OS tissues (n=13) and adjacent cancerous tissues (n=13). (E) High/low H score of MT1G ICH images. (ns, p >0.05; *p <0.05; **p <0.01; ***p <0.001).