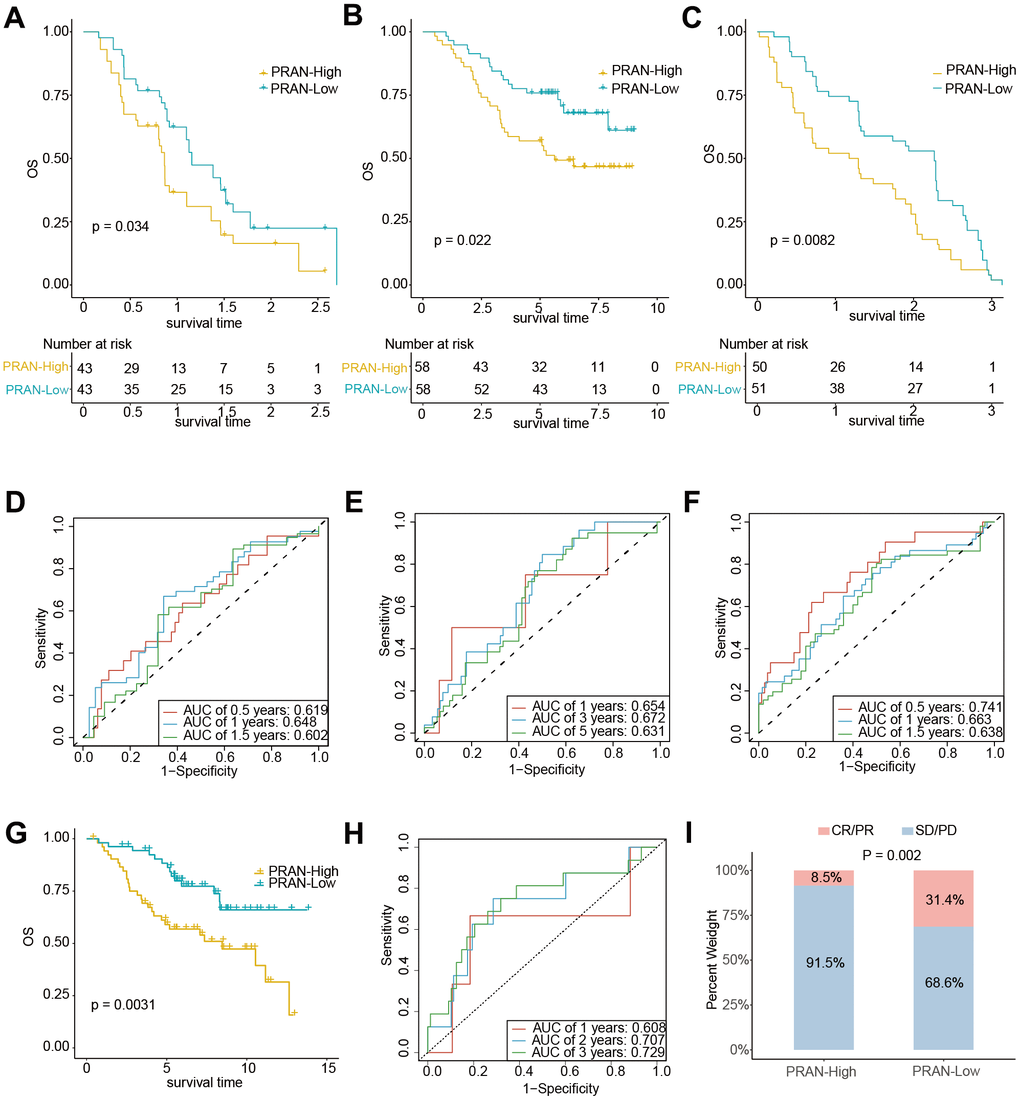
Figure 9.The predicting performance validation of the PRAN risk model in multiple GEO cohorts. (A–C) Kaplan-Meier survival analysis in NSCLC validation cohort GSE61676, GSE13213, and GSE91061. (D–F) Time-dependent ROC curves between PRAN-High and PRAN-Low groups in validation cohort GSE61676, GSE13213, and GSE377453. (G) Kaplan-Meier survival analysis in validation cohort GSE74777. (H) Time-dependent ROC curves between PRAN-High and PRAN-Low groups in validation cohort GSE74777. (I) The predicting performance of immunotherapeutic efficiency of PRAN risk model in the GSE91061 cohort.