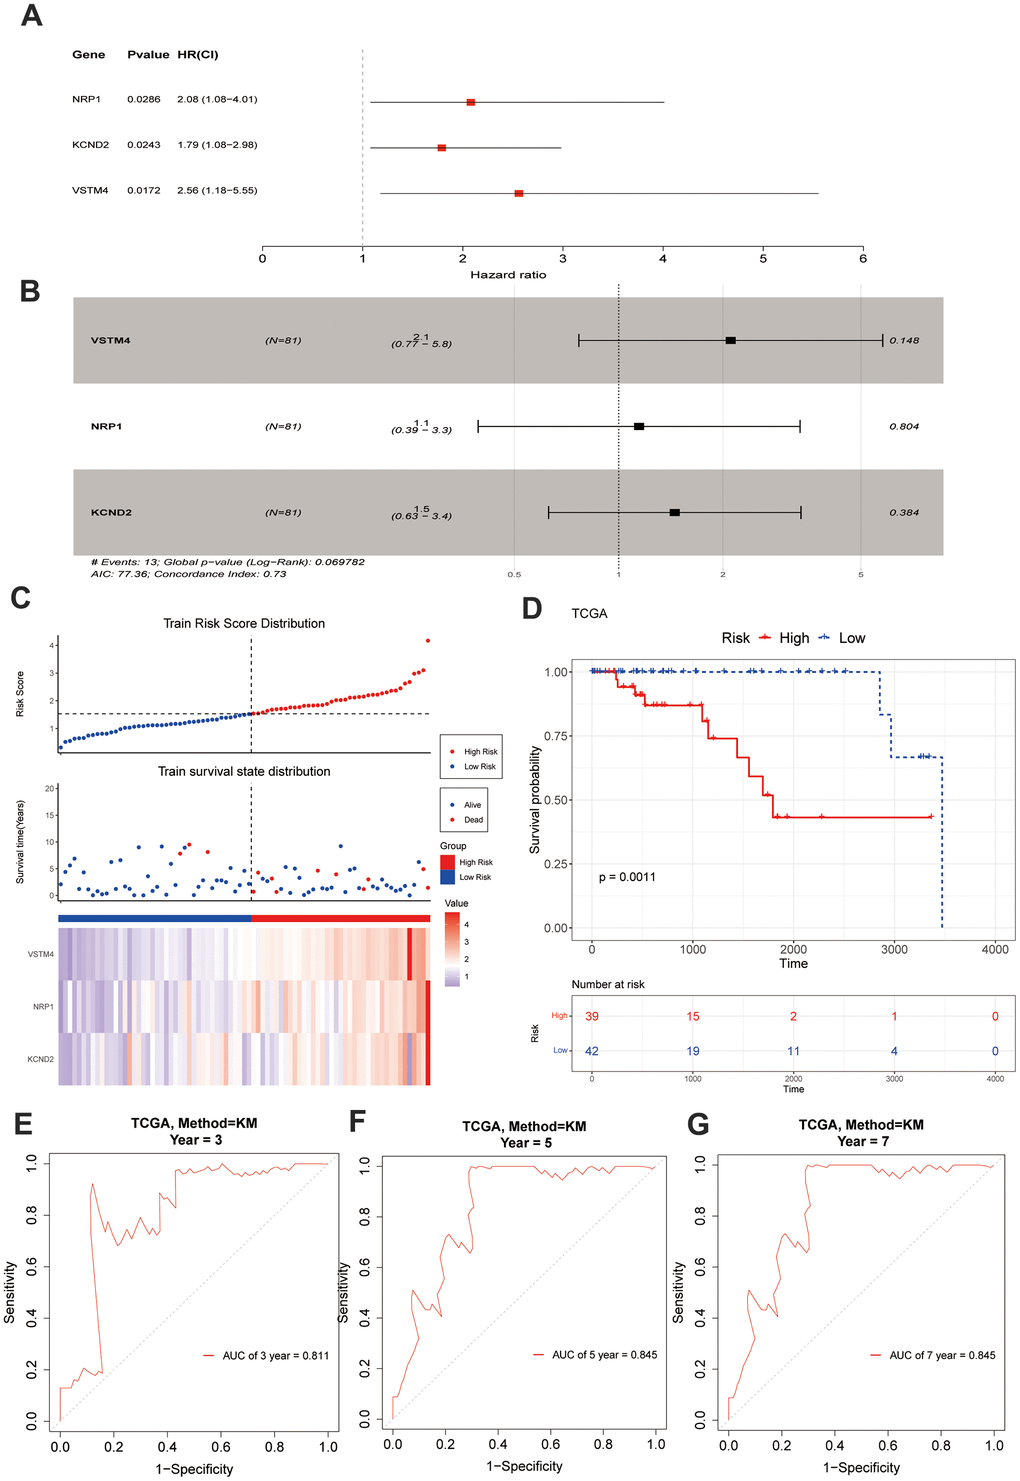
Figure 2.Construction and evaluation of risk score. (A, B) A forest chart exhibits VM-associated genes obtained through regression analysis. (C) The model delineates the patients' risk score distribution, their survival status, and a heatmap illustrating the gene expression. (D) A significant survival discrepancy was noted between the high-risk and low-risk groups, as evidenced by their respective KM survival curves. (E–G) The ROC curves from the training set display distinct AUC values corresponding to the 3-year, 5-year, and 7-year overall survival times, respectively.