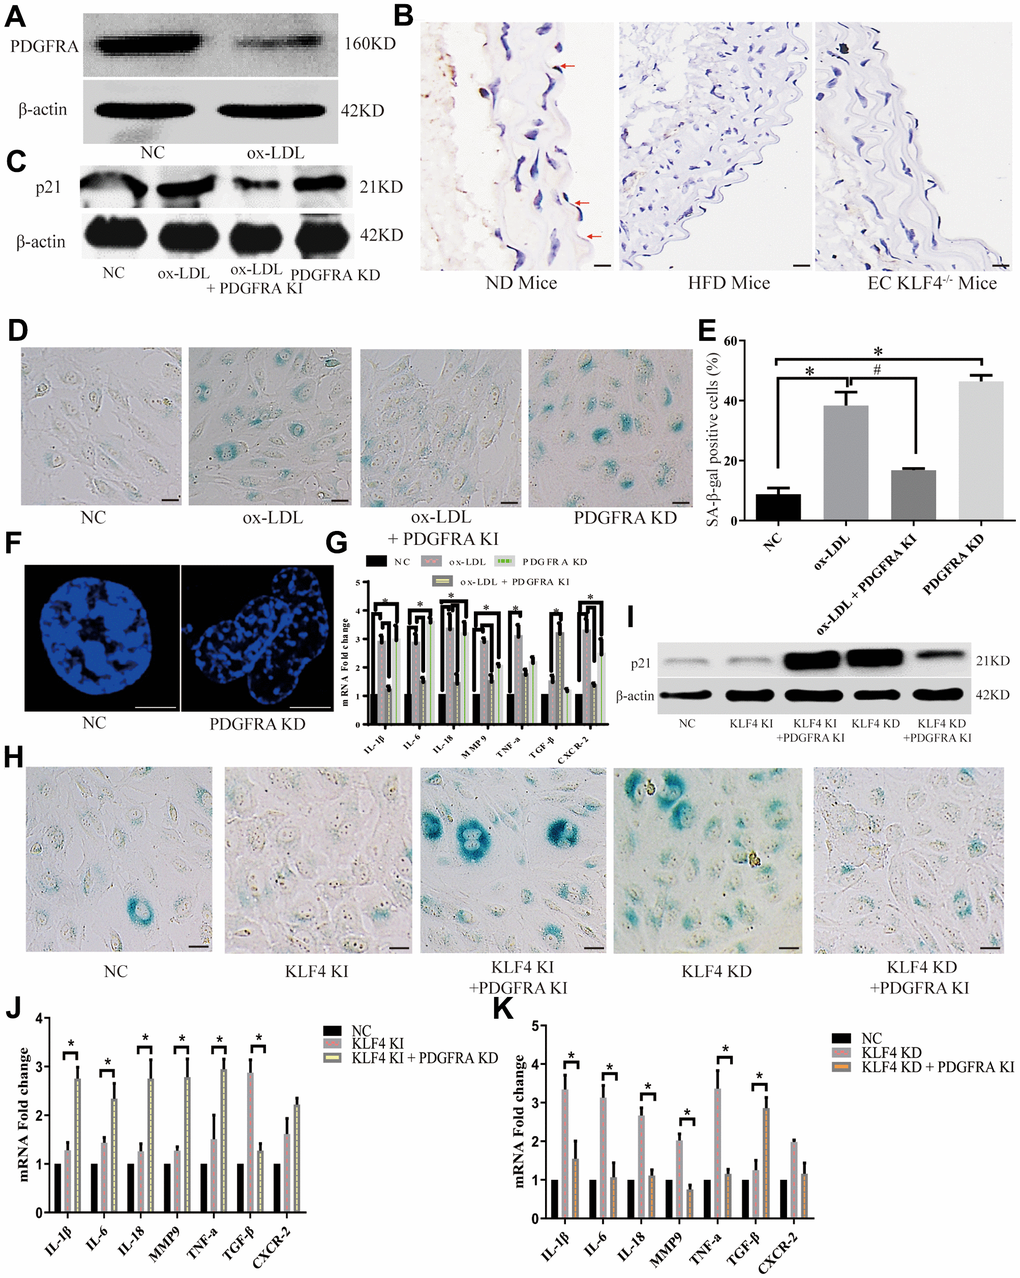
Figure 4.KLF4 inhibited the HUVEC SASP through PDGFRA. (A) Western blotting analysis of PDGFRA protein expression in ox-LDL-treated HUVECs (n=5). (B) Immunohistochemical detection of PDGFRA protein expression in the intima of ND-fed WT mice, HFD-fed WT mice and HFD-fed EC KLF4-/- mice. Scale bar, 200 μm. Representative images (n=5) are shown. Red arrow, PDGFRA-positive endothelial cells. (C) Western blotting analysis of p21 protein expression in ox-LDL-treated HUVECs after altered PDGFRA expression (n=5). (D) Histochemical detection of SA-β-gal-positive ECs in ox-LDL-treated HUVECs after altered PDGFRA expression. Scale bar, 50 μm. Representative images (n=5) are shown. Blue, SA-β-gal-positive ECs. (E) SA-β-gal staining positive cells were counted and presented as percentage of total cells. (F) Immunofluorescence detection of typical SAHF formation in cultured HUVECs (n=5). Scale bar, 20 μm. (G) qPCR analysis of the mRNA levels of cytokines in ox-LDL-treated HUVECs after regulating PDGFRA (n=5). *P < 0.05. (H) Histochemical detection of SA-β-gal-positive ECs in KLF4-treated HUVECs after regulating PDGFRA. Scale bar, 50 μm. Representative images (n=5) are shown. Blue, SA-β-gal-positive ECs. (I) Western blotting analysis of p21 protein expression in KLF4-treated HUVECs after regulating PDGFRA (n=5). (J) qPCR analysis of the mRNA levels of cytokines in KLF4-knock-in HUVECs after PDGFRA knockdown (n=5). *P < 0.05. (K) qPCR analysis of cytokine mRNA levels in KLF4-knockdown HUVECs after PDGFRA knock-in (n=5). *P < 0.05.