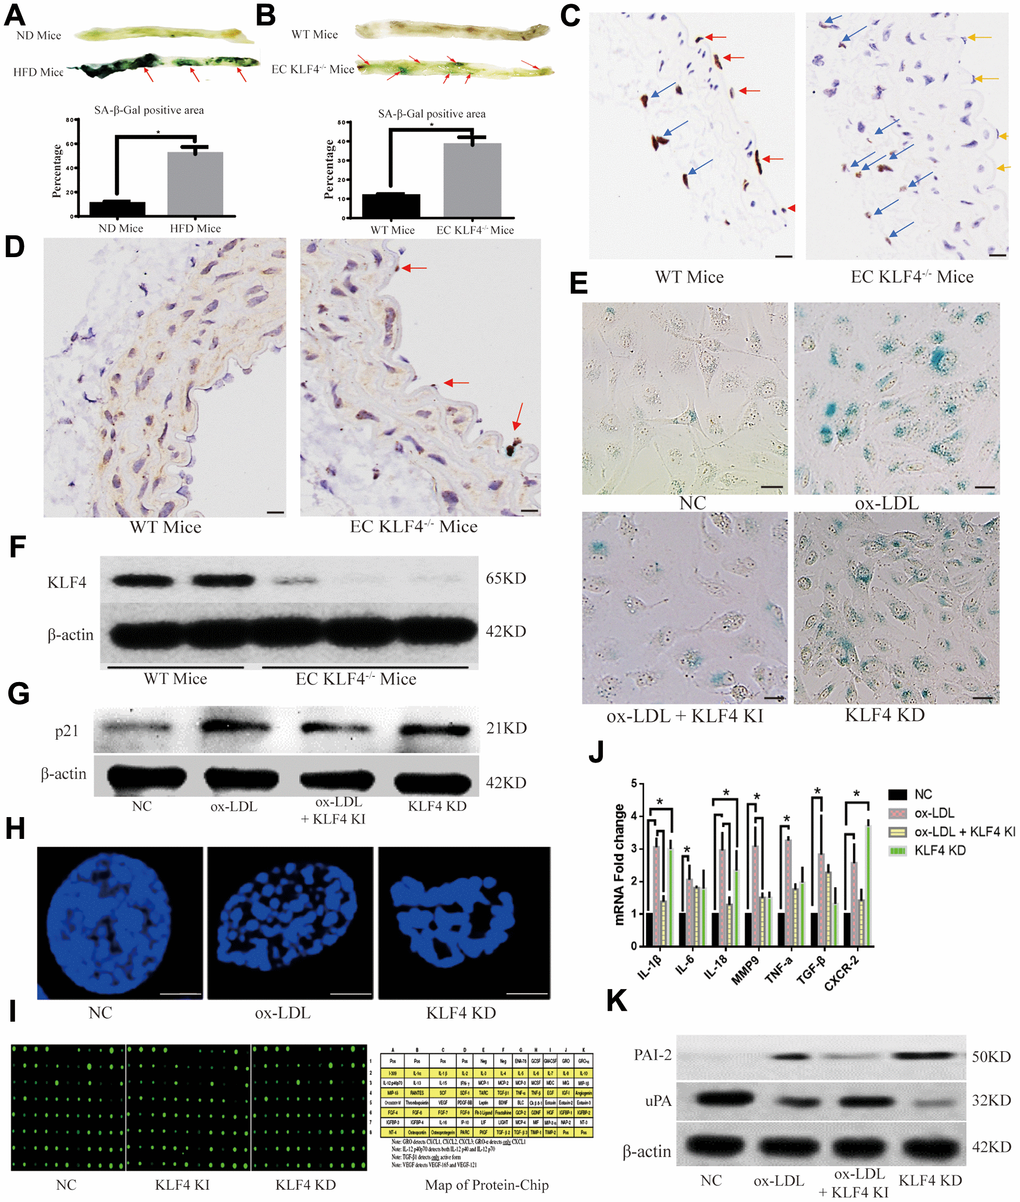
Figure 2.KLF4 inhibits the EC SASP. (A) Histochemical detection of the SA-β-gal-positive area in the vascular wall of mice fed a high-fat diet. Representative images (n=5) are shown. Red arrow, SA-β-gal-positive intima. (B) Immunohistochemical detection demonstrates the efficiency of specific conditional KLF4 knockout in mouse endothelial cells (EC KLF4-/-). Scale bar, 200 μm. Representative images (n=5) are shown. Red arrow, KLF4 expression in normal mouse intima. Yellow arrow, intima lacking KLF4 expression in mice fed a high-fat diet. Blue arrow, KLF4 expression in adventitial fibroblasts. (C) Histochemical detection of SA-β-gal-positive areas in the vascular wall of EC KLF4-/- mice. Scale bar, 1 cm. Representative images (n=5) are shown. Red arrow, SA-β-gal-positive intima. (D) Immunohistochemical detection of p21 protein expression in the intima of EC KLF4-/- mice. Scale bar, 200 μm. Representative images (n=5) are shown. Red arrow, p21-positive endothelial cells. (E) Histochemical detection of SA-β-gal-positive ECs in HUVECs. Scale bar, 50 μm. Representative images (n=5) are shown. Blue, SA-β-gal-positive ECs. (F) Western blotting analysis of KLF4 protein expression in the intima of EC KLF4-/- mice. (G) Western blotting analysis of p21 protein expression in HUVECs after KLF4 expression is altered (n=5). (H) Immunofluorescence detection of typical SAHF formation in HUVECs (n=5). Scale bar, 5 μm. (I) Protein chip analysis in HUVECs (n=3). (J) qPCR analysis of the mRNA levels of cytokines in HUVECs (n=5). *P < 0.05. (K) Western blotting analysis of PAI-2 and uPA protein expression in HUVECs (n=5).