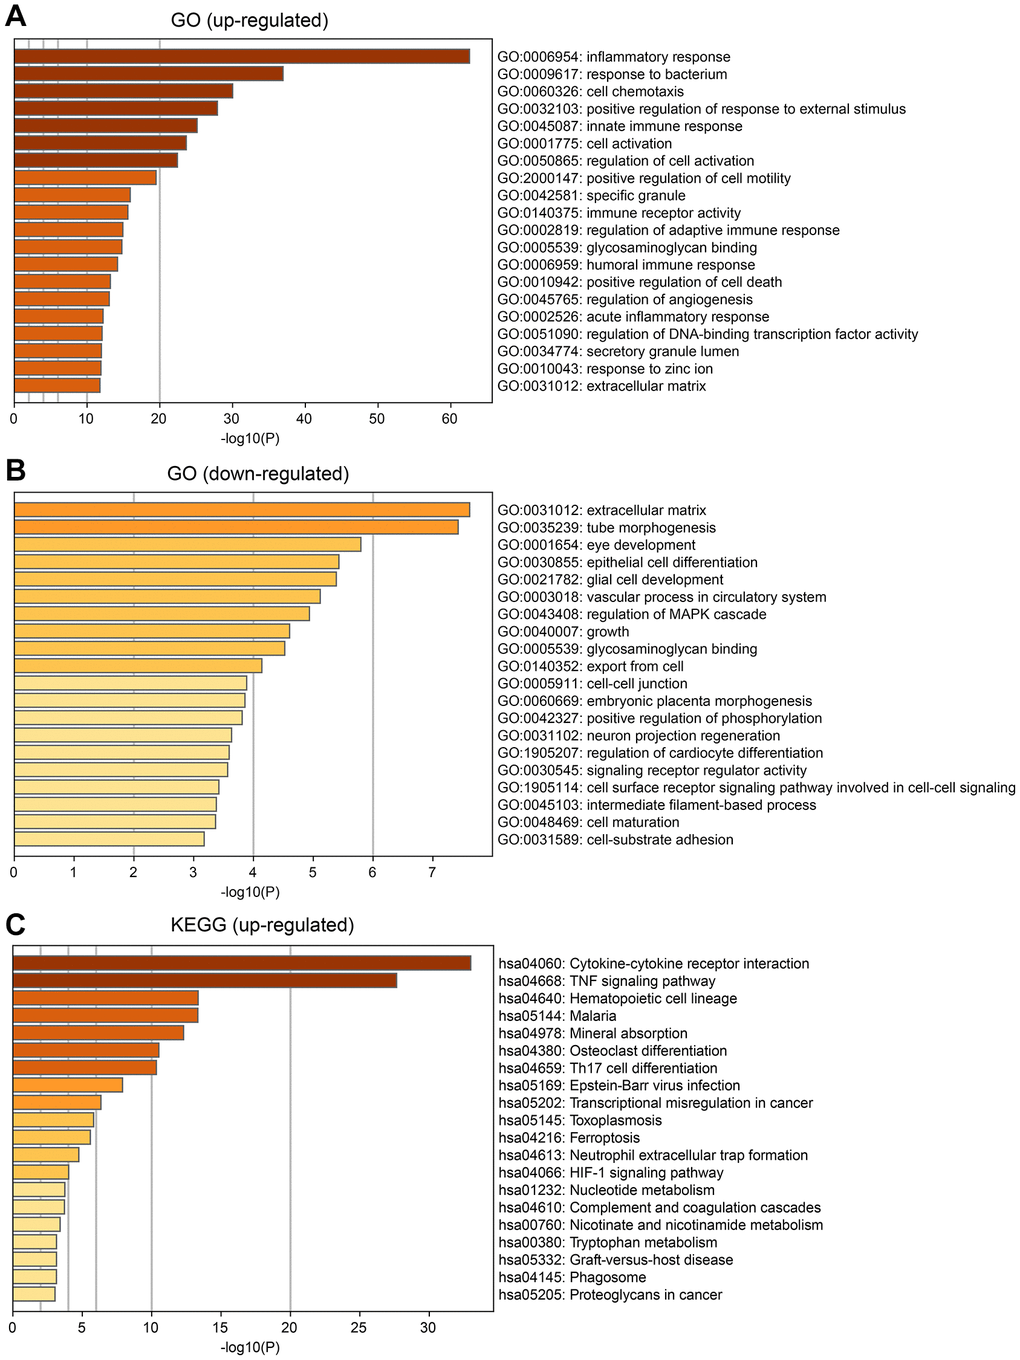
Figure 5.Enrichment analysis of differential expression genes between the two subtypes. (A) Gene Ontology (GO) enrichment analysis for up-regulated DEGs. (B) GO enrichment analysis for down-regulated DEGs. (C) KEGG analysis for up-regulated DEGs.
Figure 5 — Bioinformatics analysis for constructing a cellular senescence-related age-related macular degeneration diagnostic model and identifying relevant disease subtypes to guide treatment | Aging