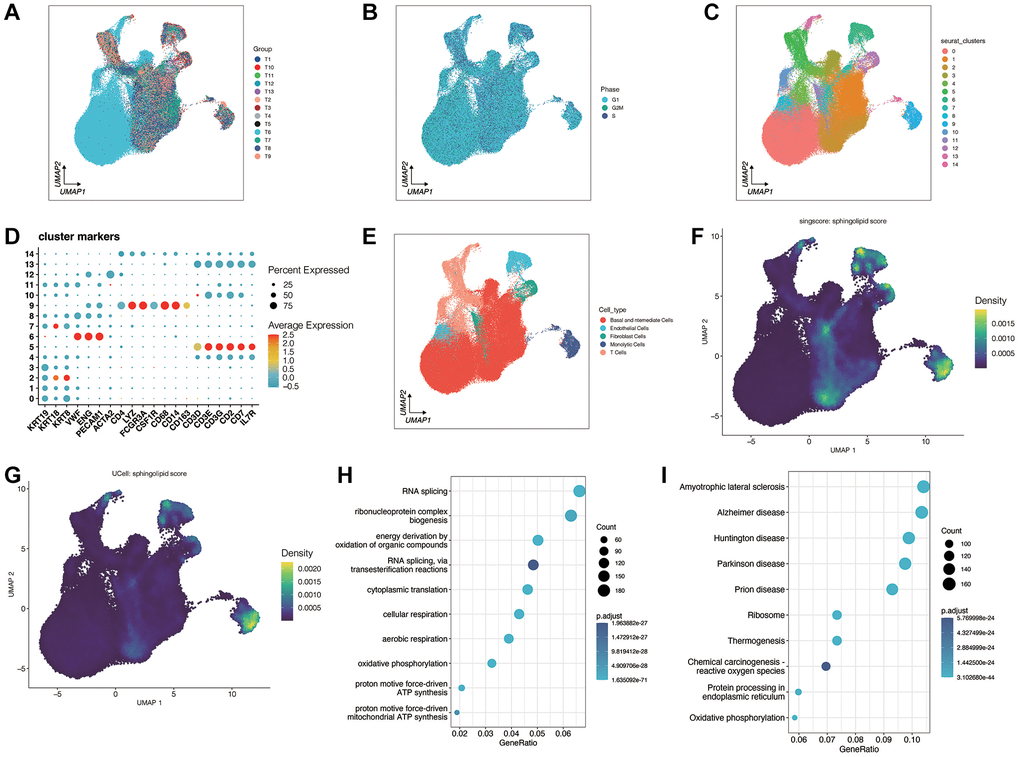
Figure 1.Analysis of single-cell sequencing data for prostate cancer. (A, B) Quality control and sample integration. (C–E) The dimensionality reduction clustering was performed on all cells. All cells are grouped into 15 clusters. After annotating the different clusters, a total of five cell types were obtained. (F, G) A sphingolipid metabolism score was performed. (H, I) Gene enrichment analysis between high sphingolipid metabolism score group and low sphingolipid metabolism score group.