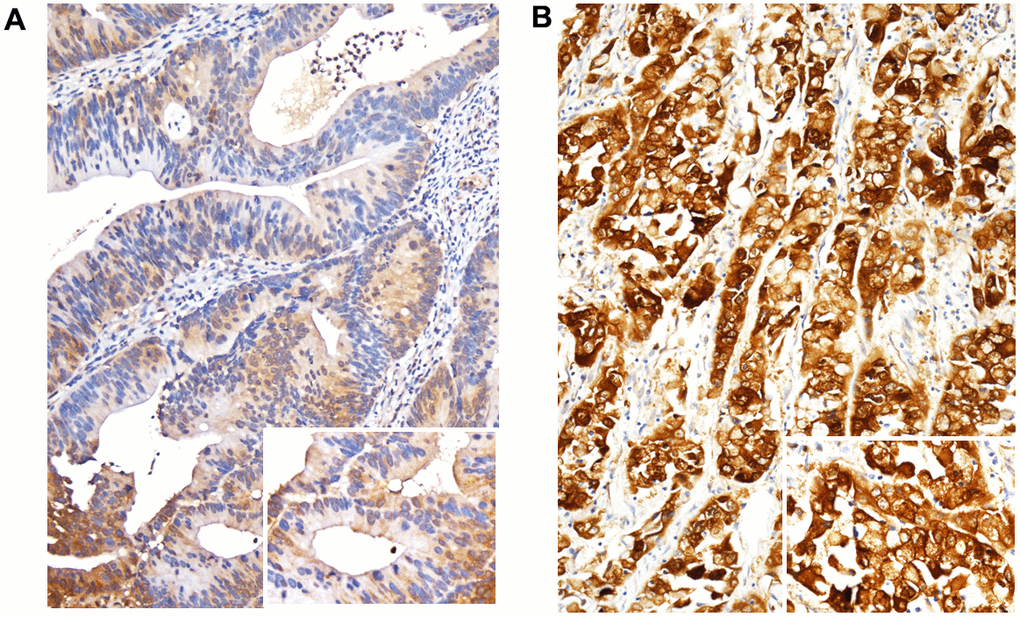
Figure 2.Immunohistochemical expression of FCGBP. Representative images of rectal cancer exhibiting FCGBP expression among tumor tissues. (A) Chemoradiotherapy responder with low FCGBP expression. (B) Chemoradiotherapy non-responder with high FCGBP expression. Representative images were captured at x200 magnification.