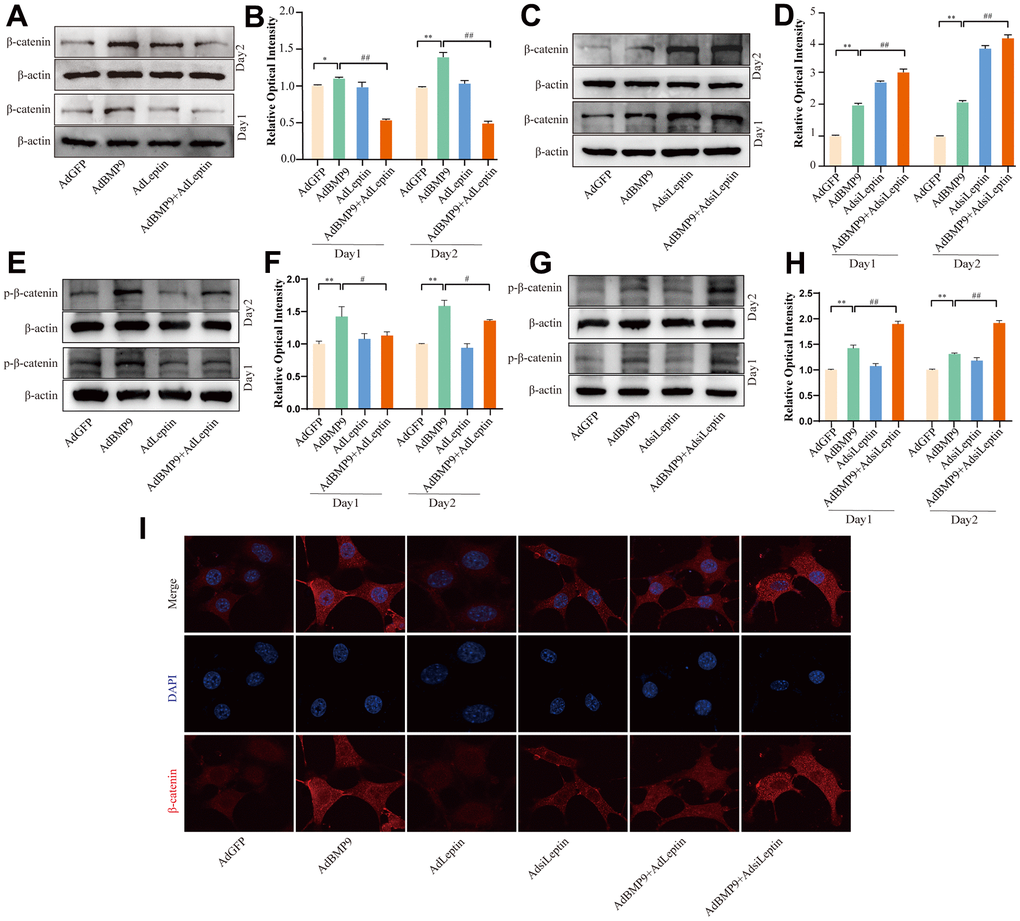
Figure 4.The effects of BMP9 and/or Leptin on Wnt/β-catenin in C3H10T1/2 cells. (A) Western blot assay shows the effect of overexpressing Leptin on β-catenin. (B) Semi-quantification of the level of β-catenin. (C) Western blot assay shows the effect of knocking down Leptin on β-catenin. (D) Semi-quantification of the level of β-catenin. (E) Western blot assay shows the effect of overexpressing Leptin on phosphorylated β-catenin. (F) Semi-quantification of the level of phosphorylated β-catenin. (G) Western blot assay shows the effect of knocking down Leptin on phosphorylated β-catenin. (H) Semi-quantification of the level of phosphorylated β-catenin. (I) Confocal assay shows the effect of Leptin on β-catenin. (“*” P < 0.5, “**” P < 0.01 vs. the control; “#” P< 0.05, “##” P < 0.01).