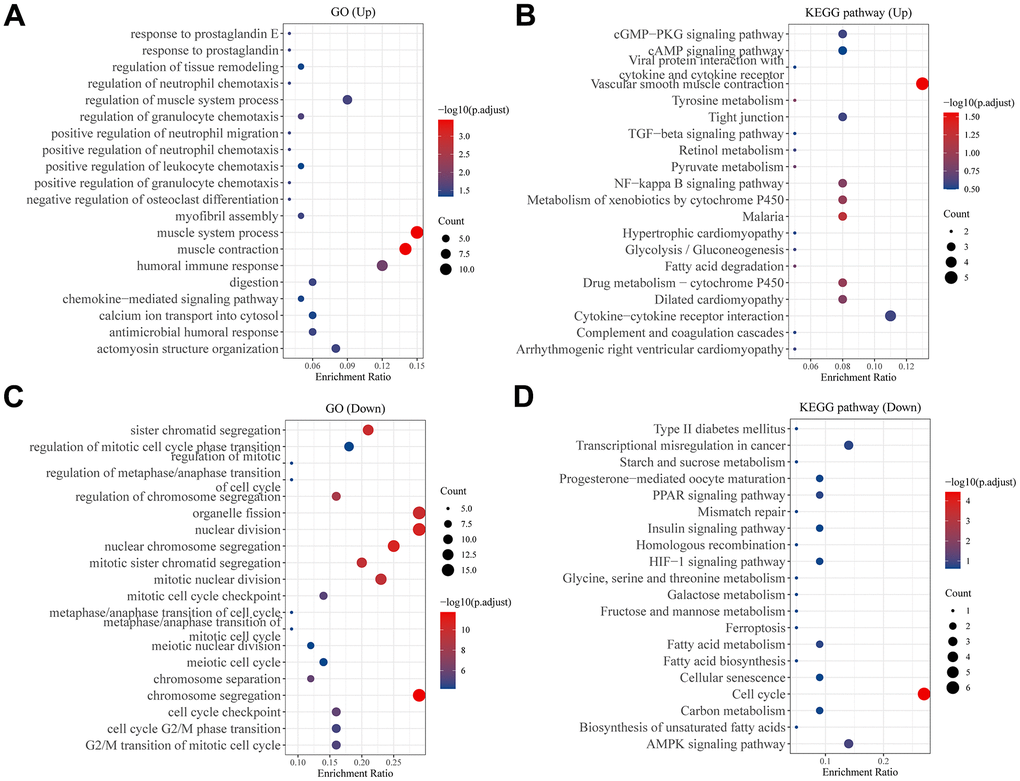
Figure 4.Analysis of differentially expressed genes between two subtypes. Bubble plot of (A) GO and (B) KEGG pathway enrichment analysis of up-regulated genes in C1 group patients. Bubble plot of (C) GO and (D) KEGG pathway enrichment analysis of down-regulated genes in C1 group patients. Each graph showed the top twenty enriched pathways.