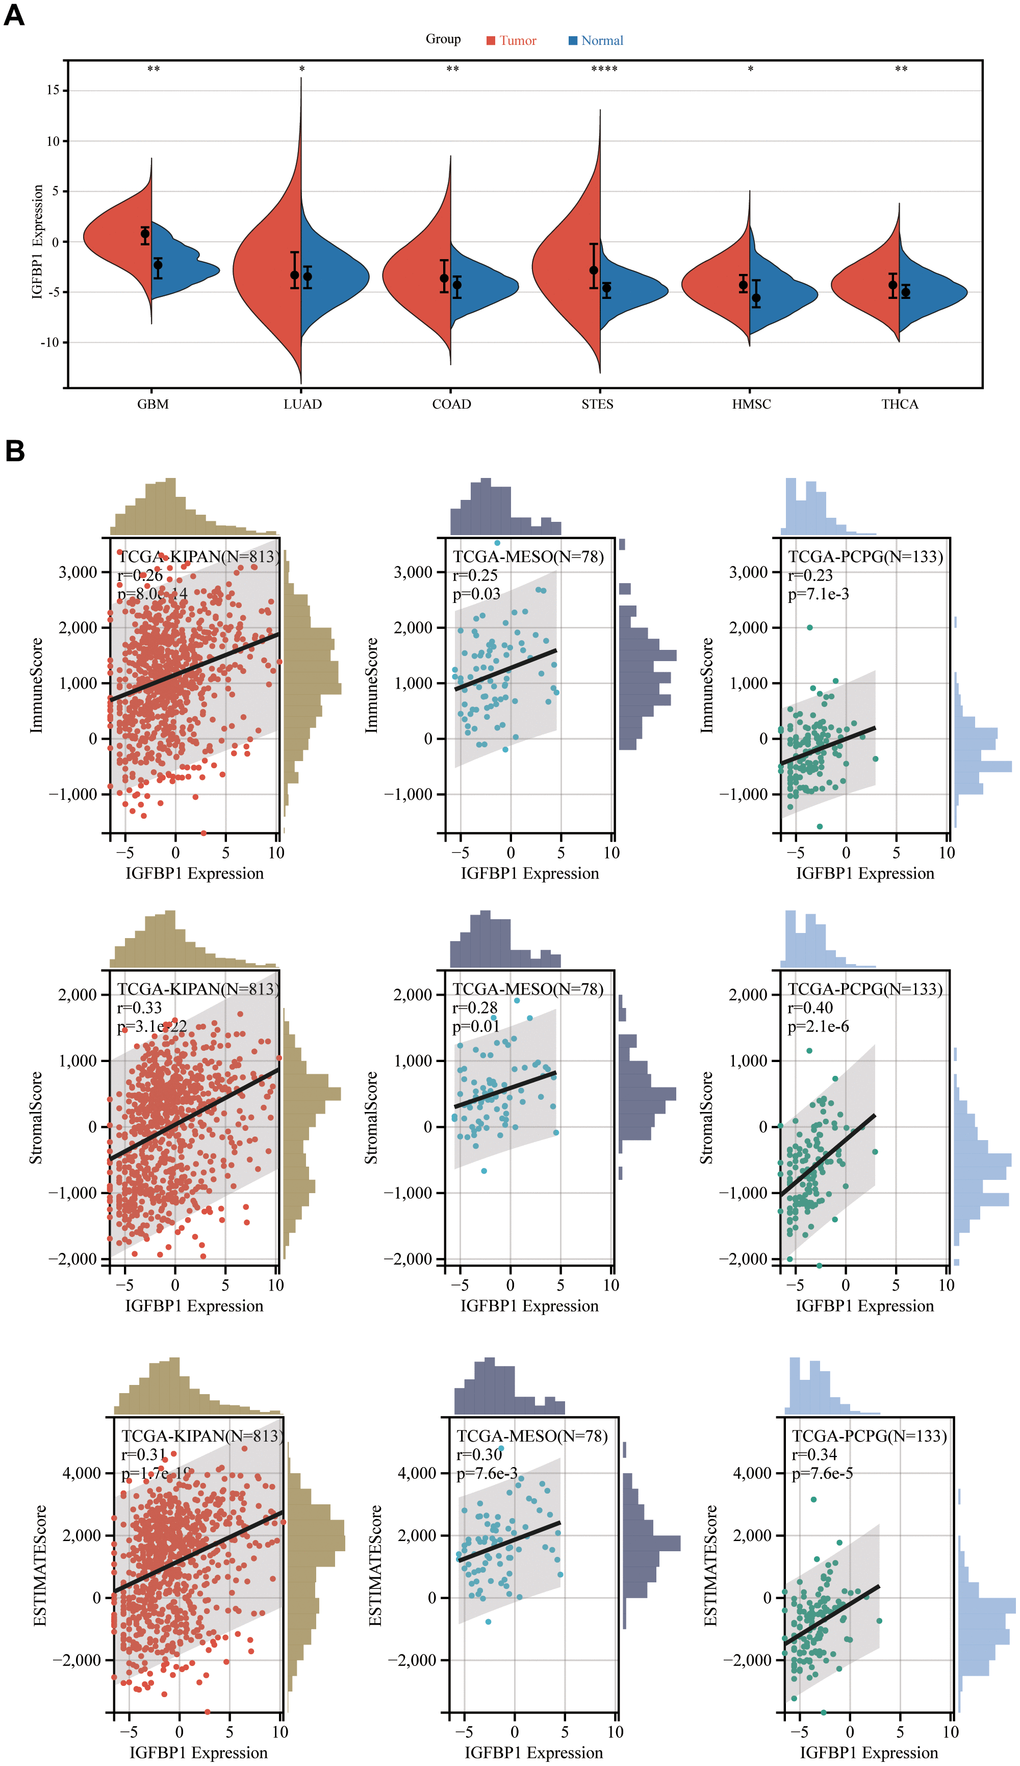
Figure 13.Pan-cancer analysis of IGFBP1. (A) The expression of IGFBP1 was compared between tumor tissue and normal tissue in other different types of cancer. (B) Association of IGFBP1 expression and immune score, stromal score or tumor purity was evaluated using ESTIMATE analysis. GBM, glioblastoma multiforme; LUAD, lung adenocarcinoma; COAD, colon adenocarcinoma; STES, stomach and esophageal carcinoma; HNSC, head and neck squamous cell carcinoma; THCA, thyroid carcinoma; KIPAN, pan-kidney carcinoma; MESO, mesothelioma; PCPG, pheochromocytoma and paraganglioma. *P < 0.05, **P < 0.01, ***P < 0.001, ****P < 0.0001.