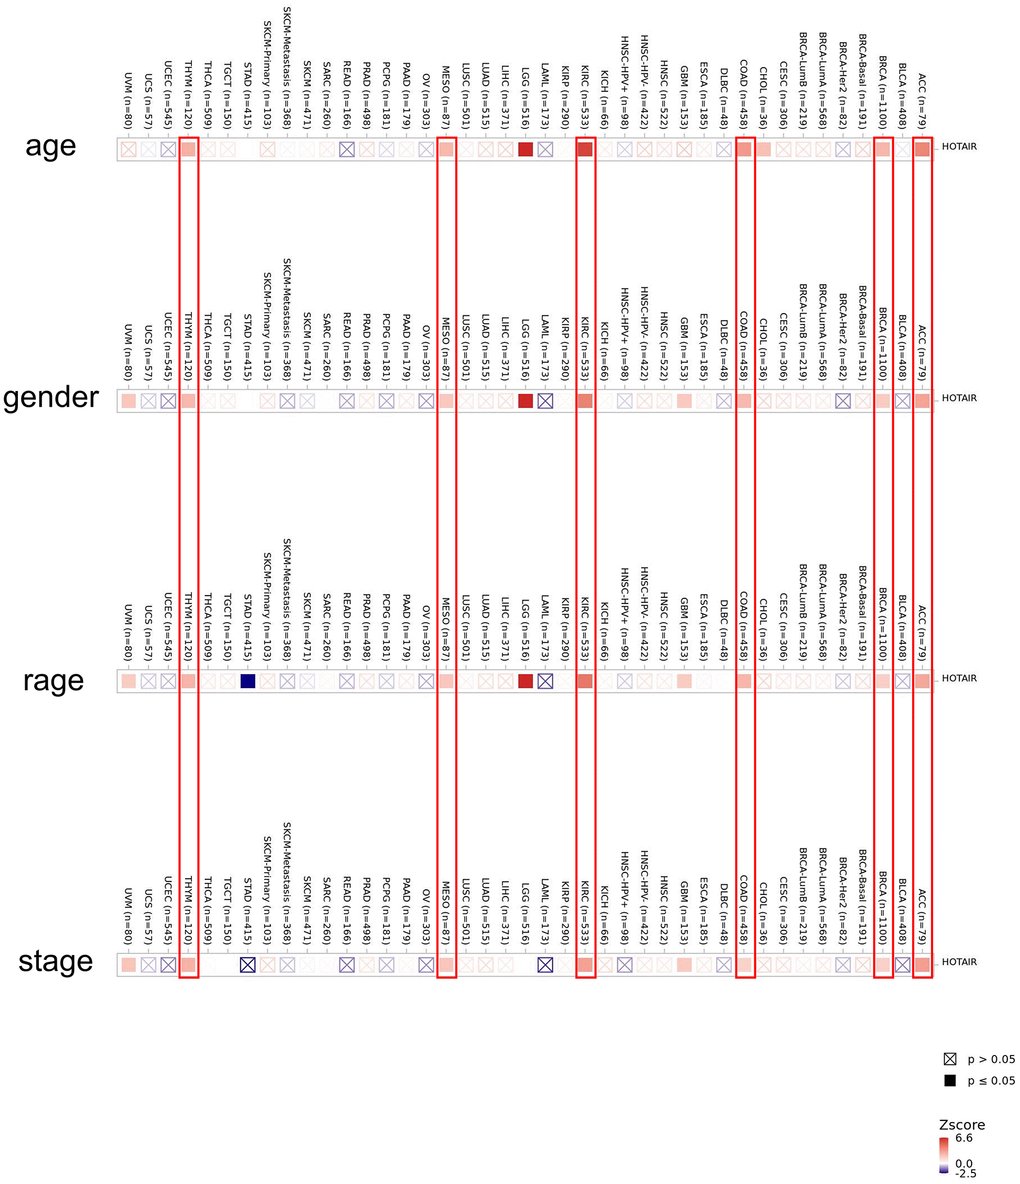
Figure 2.Correlation between HOTAIR expression level and clinicopathological parameters in human cancers including age, gender, race and stage across all tumors in TCGA. The red color indicates a positive correlation (0–1), while the blue color represents a negative correlation (−1–0). The correlation with P-value < 0.05 is considered as statistically significant. Statistically non-significant correlations values are marked with a cross.