Submit an Article
Navigate
Home
Editorial Board
Editorial Policies
Current Volume
Archive
Scientific Integrity
Publication Ethics Statements
Interviews with Outstanding Authors
Newsroom
Sponsored Conferences
Podcast
Contact
Special Collections
Submit an Article
Online ISSN: 1945-4589
Research Paper
|
Volume 16, Issue 9
|
pp. 7647–7667
GJB3: a comprehensive biomarker in pan-cancer prognosis and immunotherapy prediction
Back to article
Figure 3
(3 of 11)
−
100%
+
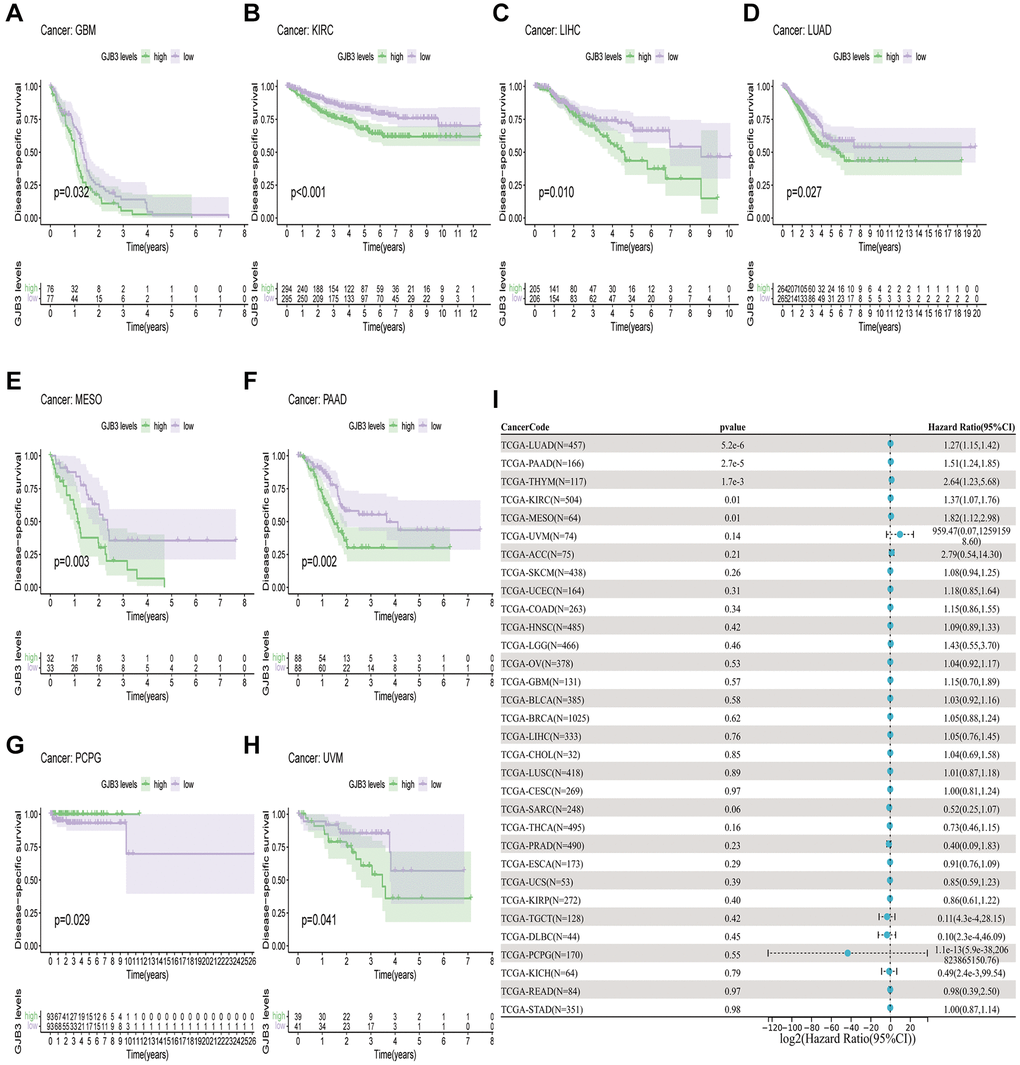
Figure 3.
A comparison of DSS prognosis in various types of cancers according to GJB3 expression.
(
A
–
H
) In the Kaplan-Meier curves, GJB3 expression is correlated with DSS expression. (
I
) Forest plot demonstrating the association between GJB3 and DSS.