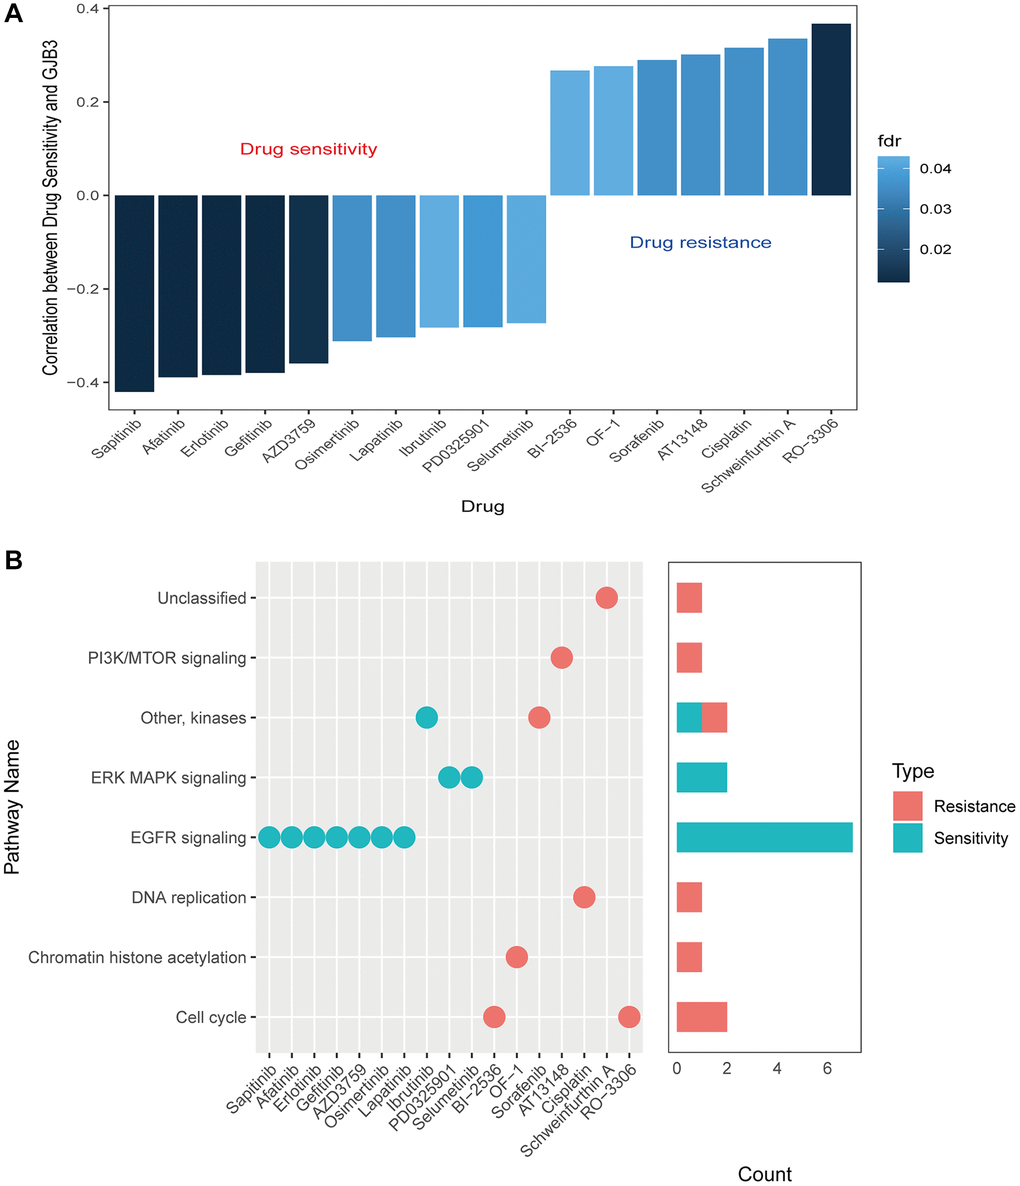
Figure 11.Drug sensitivity and expression of GJB3. (A) A graph showing the relationship between GJB3 expression and drug sensitivity as calculated by the Spearman algorithm. In each column, the color indicates the fdr, while the height indicates the correlation coefficient. (B) This graph visualizes the signaling pathways targeted by GJB3-sensitive and GJB3-resistant drugs. Right: a bar plot representing the number of drugs targeting each pathway.