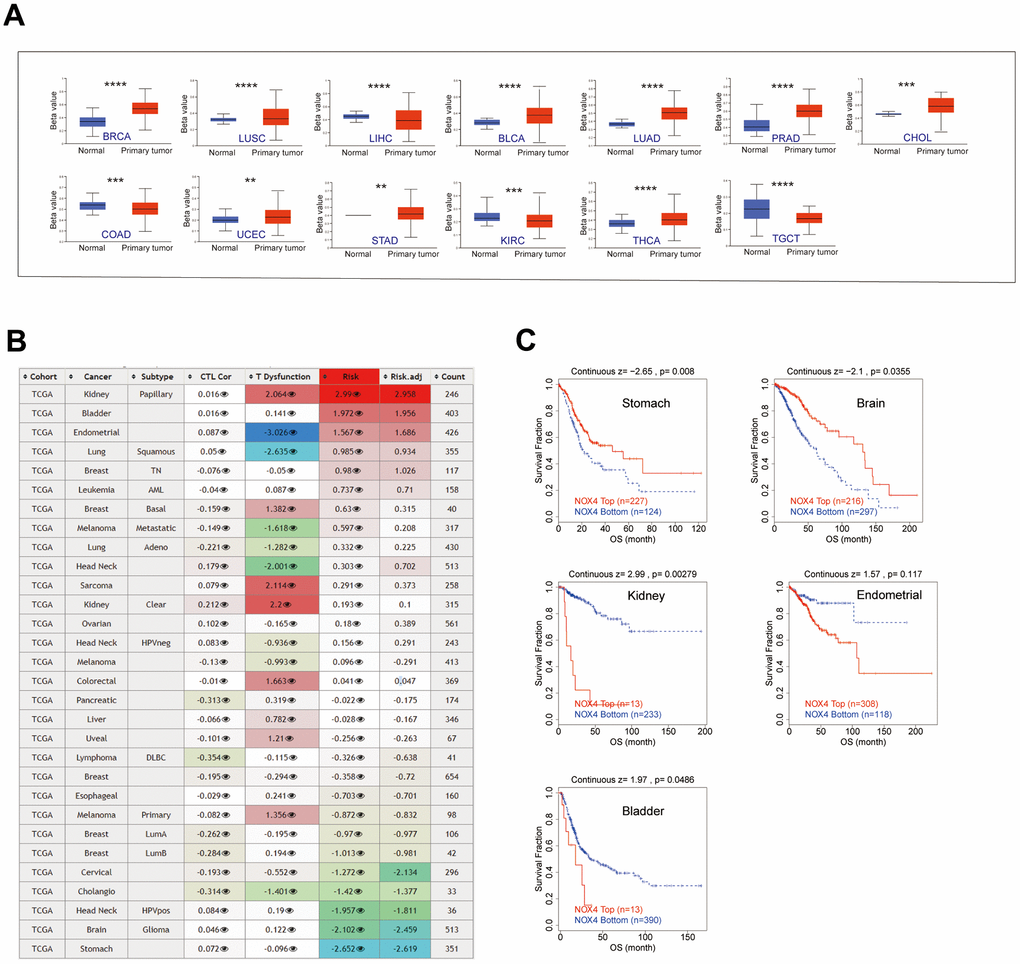
Figure 3.Epigenetic methylation analysis. (A) Boxplots depict the differential NOX4 methylation levels (beta values) across TCGA cohorts. (B) A heatmap displays the impact of NOX4 methylation on cytotoxic T-cell levels (CTLs), dysfunctional T-cell phenotypes, and risk factors within TCGA cohorts. (C) Kaplan-Meier curves compare overall survival differences between high and low NOX4 methylation levels, with statistically significant differences depicted; (**P < 0.01, ***P < 0.001, ****P < 0.0001).