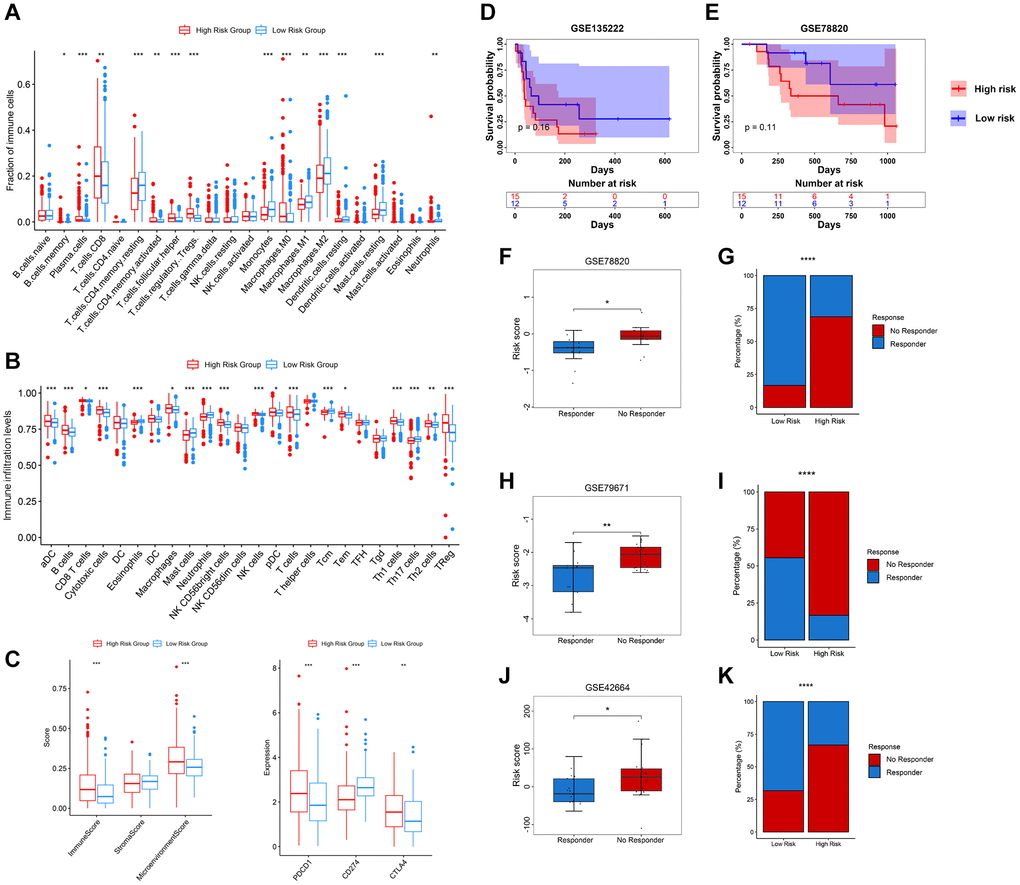
Figure 7.Relevance between tumour immune infiltration and PRERGs risk signature. (A) Fraction of immune-related cells in the high- or low-risk group. (B) Activity score of immune-related cells in the high- or low-risk group. (C) Immune score, stromal score, microenvironment score, and three immune checkpoint expressions in the high- or low-risk group. (D, E) Kaplan-Meier survival curves were portrayed to show the survival difference in the high- or low-risk group in the GSE135222 and GSE78820 datasets. (F, G) Boxplot shows the risk scores of CR/PR and SD/PD groups in the GSE78820 dataset. The barplot shows the distribution of high- or low-risk groups in CR/PR and SD/PD groups. (H, I) Boxplot shows the risk score of the response and no-response groups in the GSE79671 dataset. The barplot shows the distribution of high- or low-risk groups in the response and no-response groups. (J, K) Boxplot shows the risk score of CR/PR and SD/PD groups in the GSE42664 dataset. The barplot shows the distribution of high- or low-risk groups in CR/PR and SD/PD groups. Abbreviations: CR: complete response; PR: partial response; SD: stable disease; PD: progressive disease. *P-value < 0.05; **P-value < 0.01; ***P-value < 0.001; ****P-value < 0.0001.