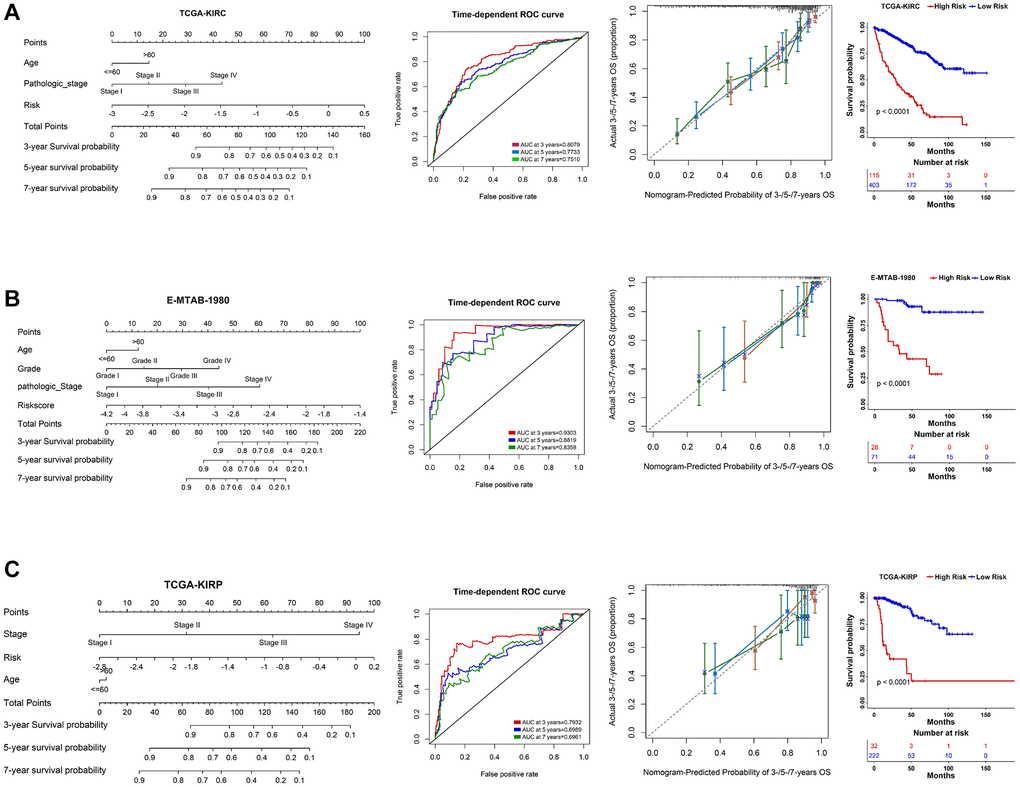
Figure 6.Nomogram construction in three RCC datasets. (A–C) A nomogram was constructed based on PRERGs and clinical variables to predict the 3-/5-/7-year survival probability of the patients in the TCGA-KIRC, TCGA-KIRP, and E-MTAB-1980 datasets. ROC and calibration analysis were performed to estimate the predicted accuracy. The Kaplan-Meier survival curve was depicted to show the prognosis difference of high- or low-risk groups which was calculated by nomogram.