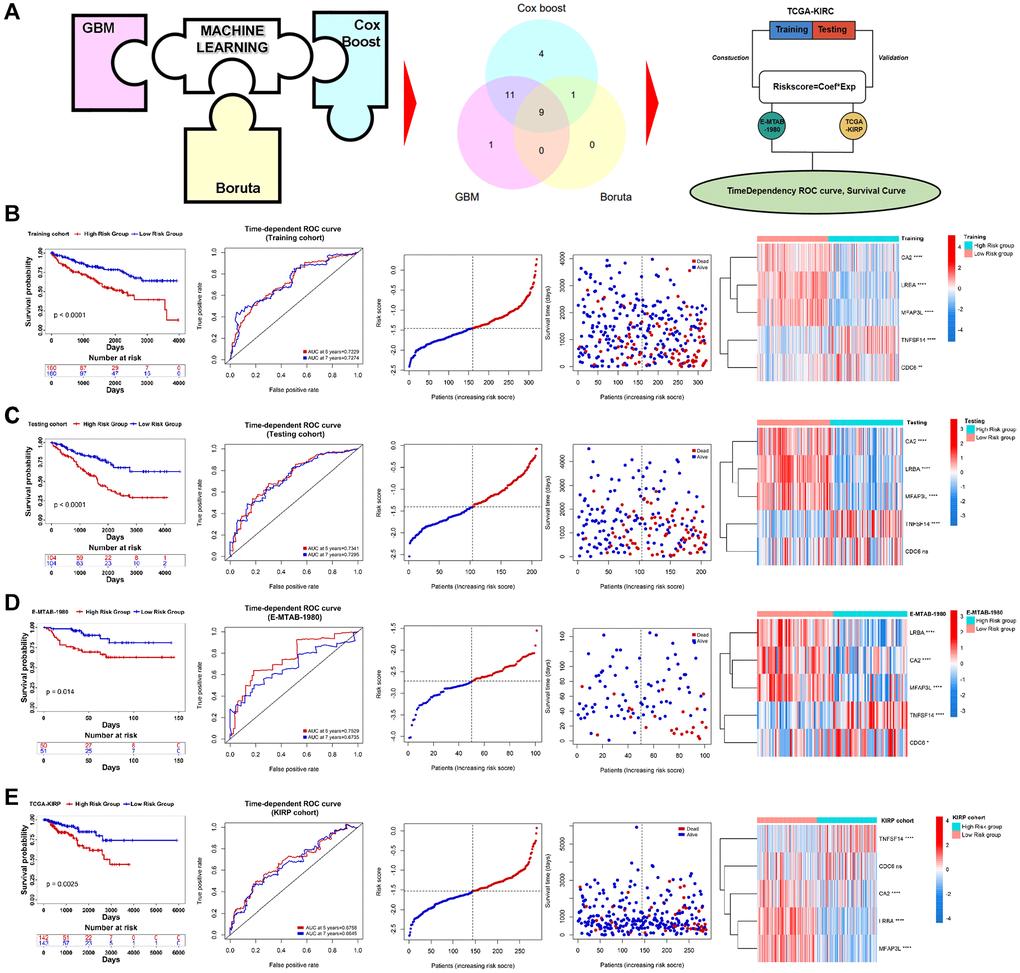
Figure 4.Construction of PRERGs signature. (A) The flow chart shows the machine-learning process. (B–E) Kaplan-Meier survival curve shows the survival differences in high- and low-risk groups. ROC curve shows the predicted accuracy of the risk score on the prognosis of the patients. The risk dot plot shows the number of dead and alive patients with gradually increasing risk scores. Heatmap shows the expression of 5 PRERGs that constructed the risk signature in the high- or low-risk group.