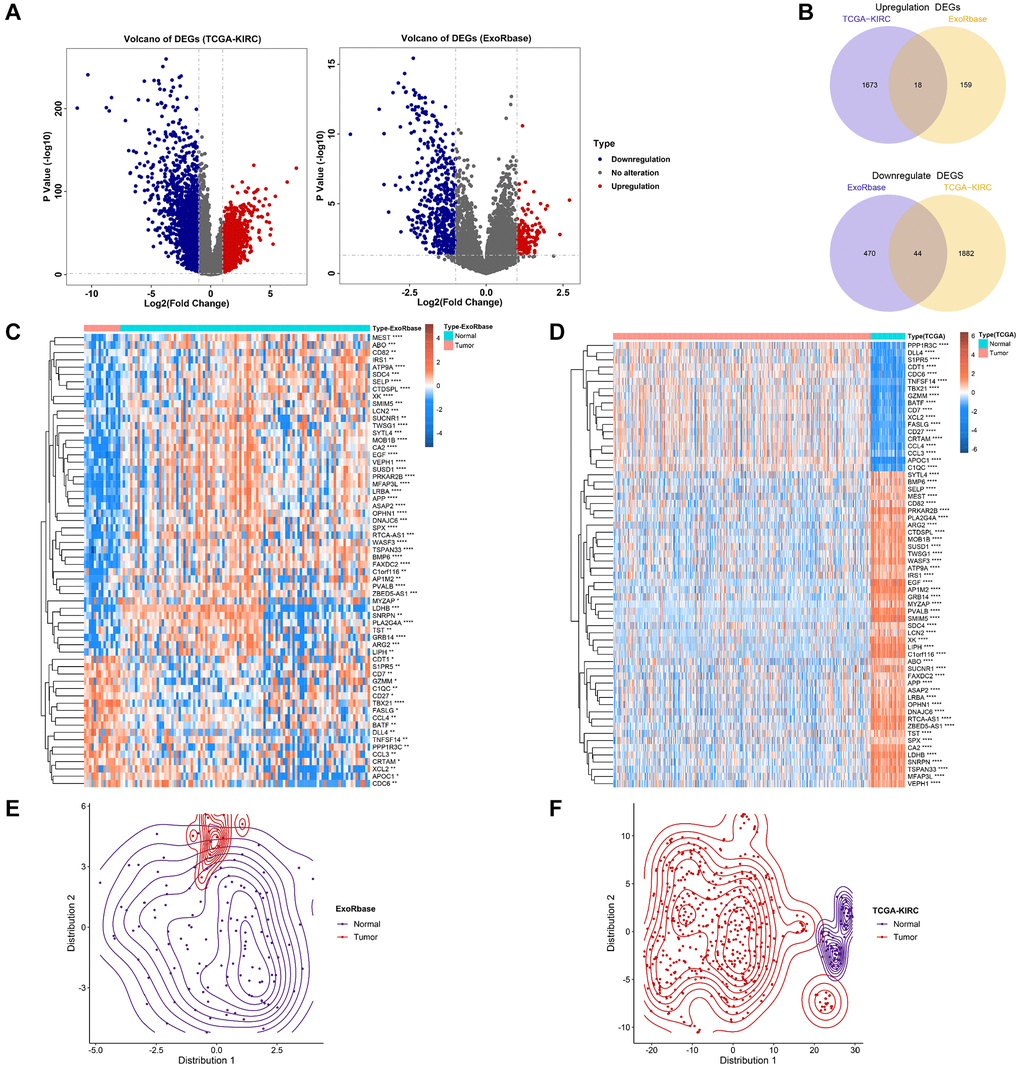
Figure 2.Identification of exosome-related genes in KIRC. (A) The volcano figure shows the differentially expressed genes between KIRC and normal control in exoRBase and TCGA-KIRC datasets. (B) The Venn diagram shows the common up-regulated genes and down-regulated genes in exoRBase and TCGA-KIRC datasets. (C, D) Heatmaps show the expression levels of ERGs in tumours and normal tissues. (E, F) T-SNE analyses were performed to show the distribution of tumour tissues and normal tissues based on ERG expression.