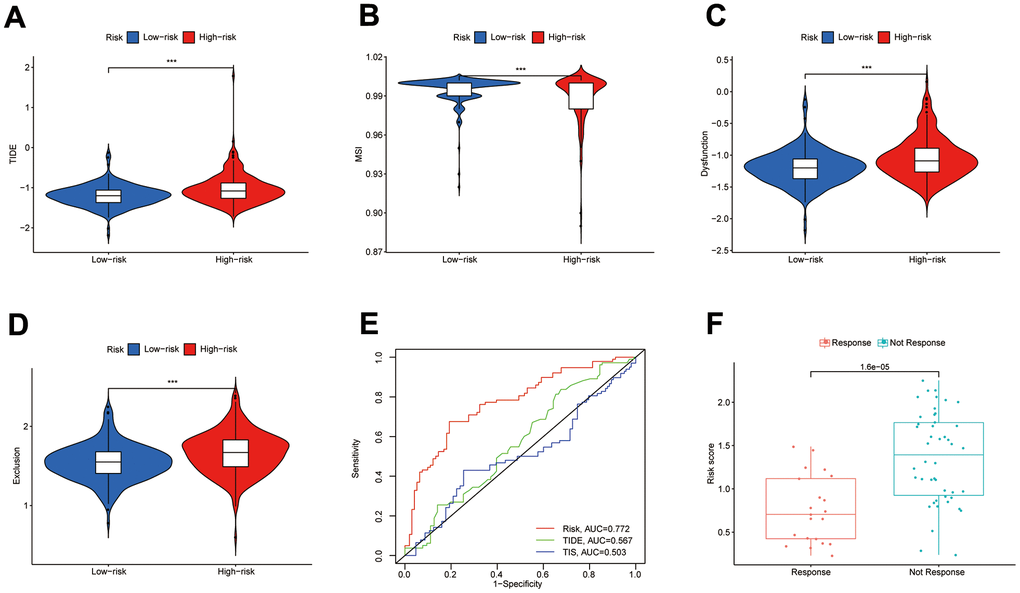
Figure 9.Value of the DPM in predicting immunotherapy outcomes. (A–D) Differences in TIDE, MSI, and T-cell dysfunction and exclusion scores between subgroups; (E) ROC curves comparing prognostic efficacy of prognostic models with those of TIDE and TIS; (F) Differences in risk scores between immune responsive and non-responsive patients (GSE109211 dataset).