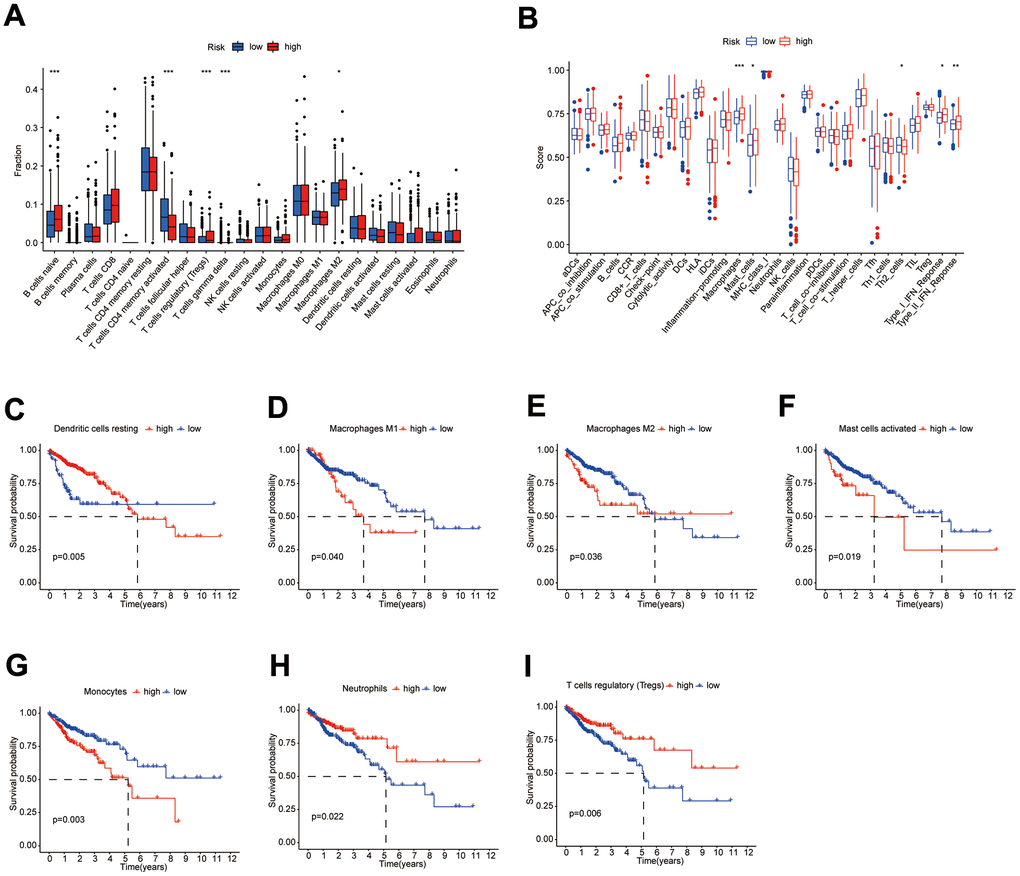
Figure 7.Differences in immune characteristics between subgroups. (A, B) Differences in the proportion of immune cells and Immune cell function scores between high- and low-risk subgroups; (C–I) KM survival curves for the proportion of 7 immune cells in high- and low-risk subgroups.