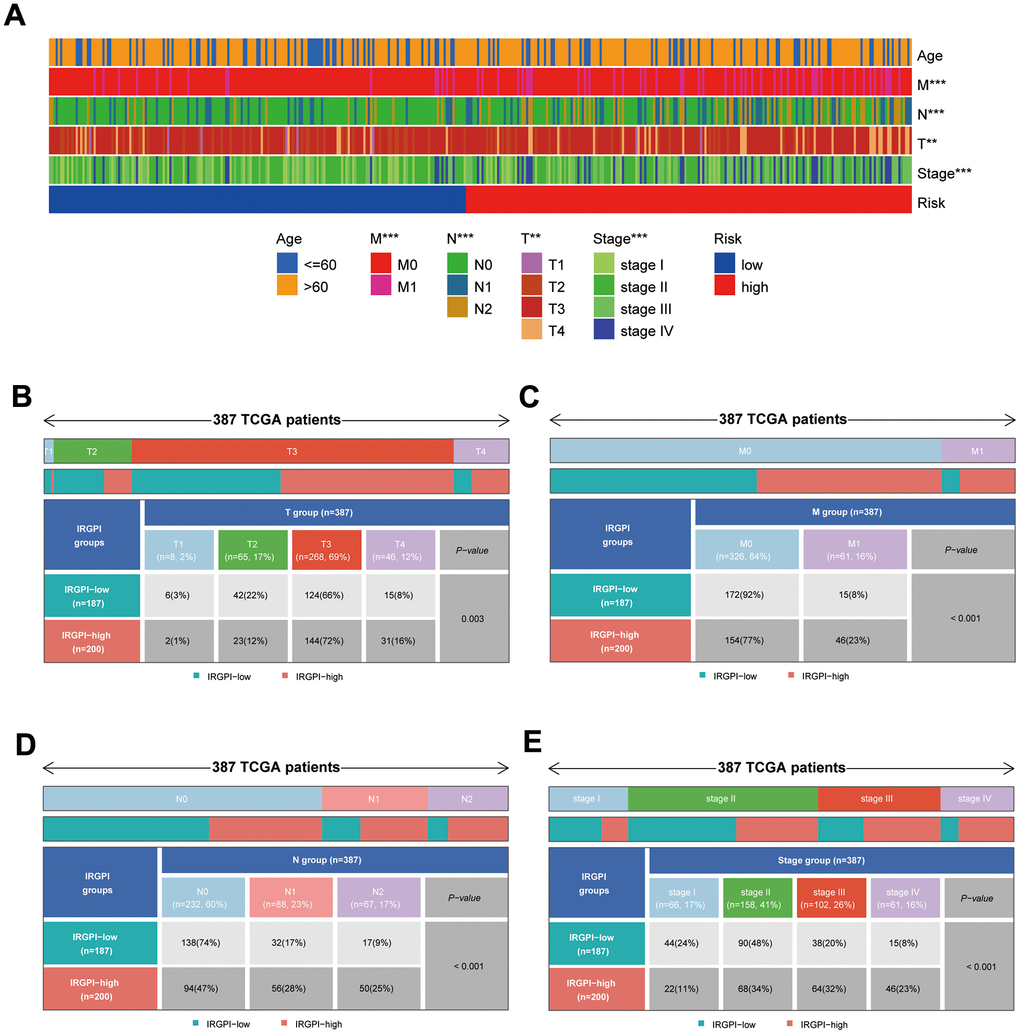
Figure 6.Results of differential analysis of clinical traits between subgroups. (A) Distribution of clinical traits between subgroups; (B–E) Results of differential analysis of T-stage, M-stage, N-stage, and stage between subgroups.
Figure 6 — Investigating gene signatures associated with immunity in colon adenocarcinoma to predict the immunotherapy effectiveness using NFM and WGCNA algorithms | Aging