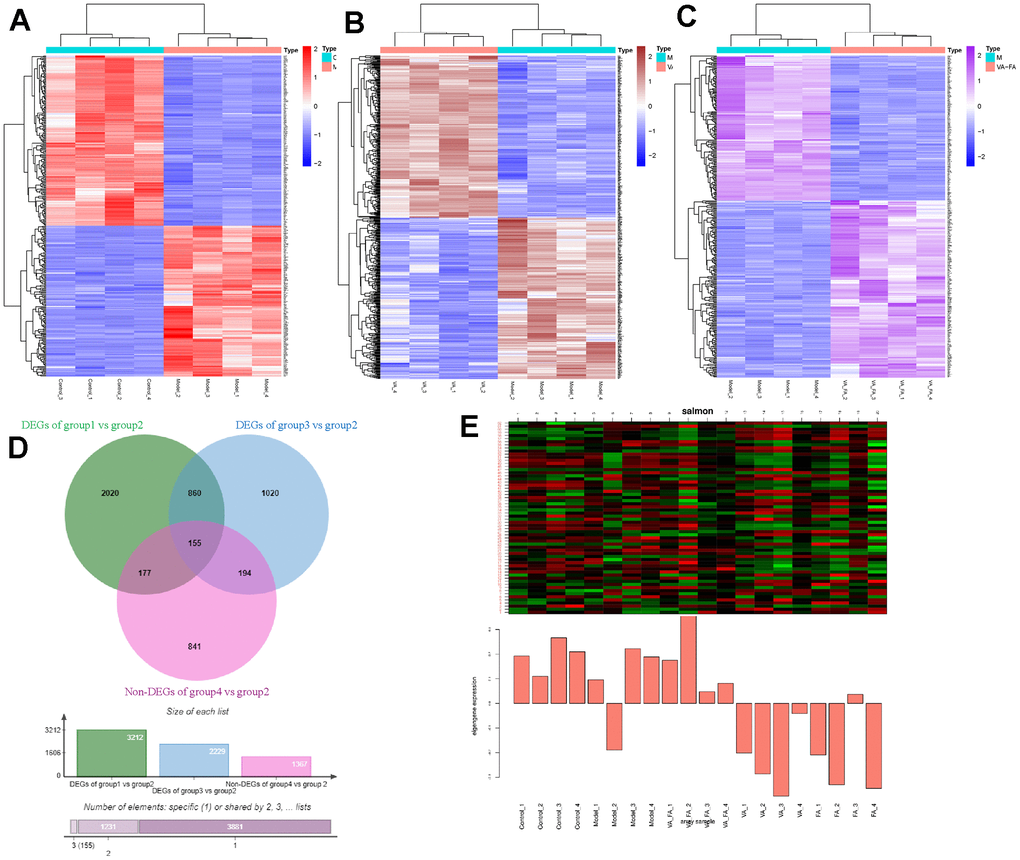
Figure 9.Significant differences in gene expression between the HaCaT cells from different groups and the model group. (Group 1: control group; group 2: UVB induce aging group; group 3: VA-FA addition group; group 4: VA addition group; group 5: FA addition group). (A–C) Heat map of DEGs in groups of control vs model, VA vs model, VA-FA vs model; (D) Venn plot of DEGs in HaCaT cell among groups; (E) Heat map of DEGs in HaCaT cell among groups.