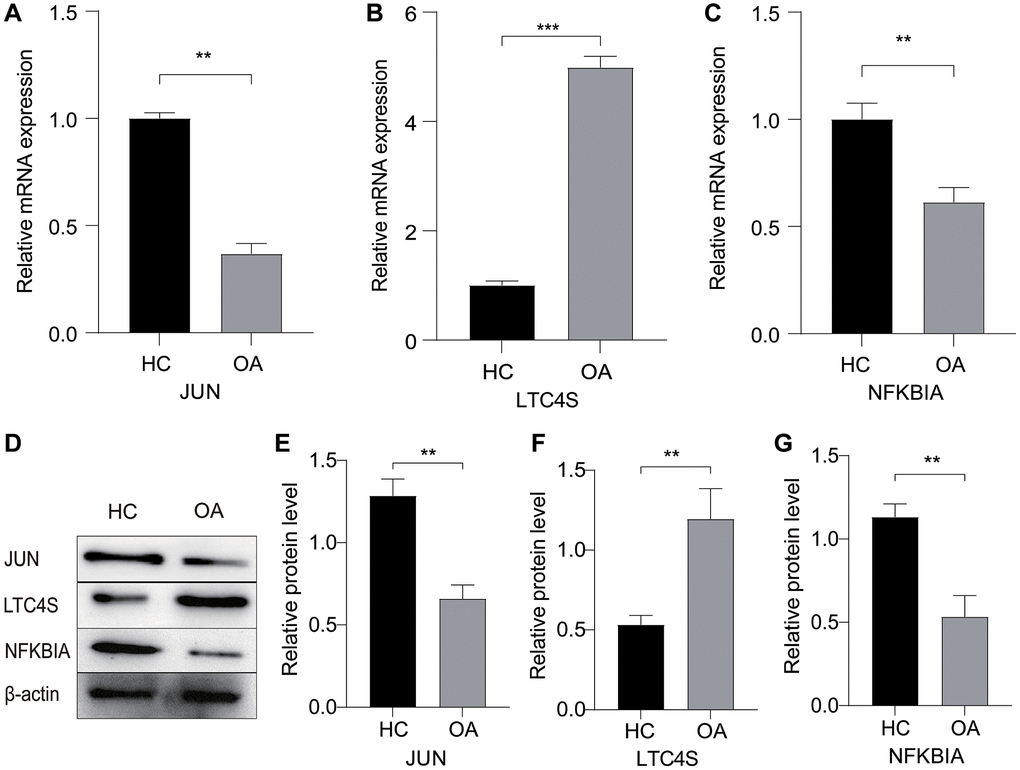
Figure 7.The expression profile of relevant genes and proteins in OA. (A–C) Changes in mRNA expression levels of JUN, LTC4S, and NFKBIA in the OA and HC groups. (D–G) Western blotting (WB) analysis of the protein expression levels of JUN, LTC4S, and NFKBIA in OA and HC. *p < 0.05, **p < 0.01, ***p < 0.001.