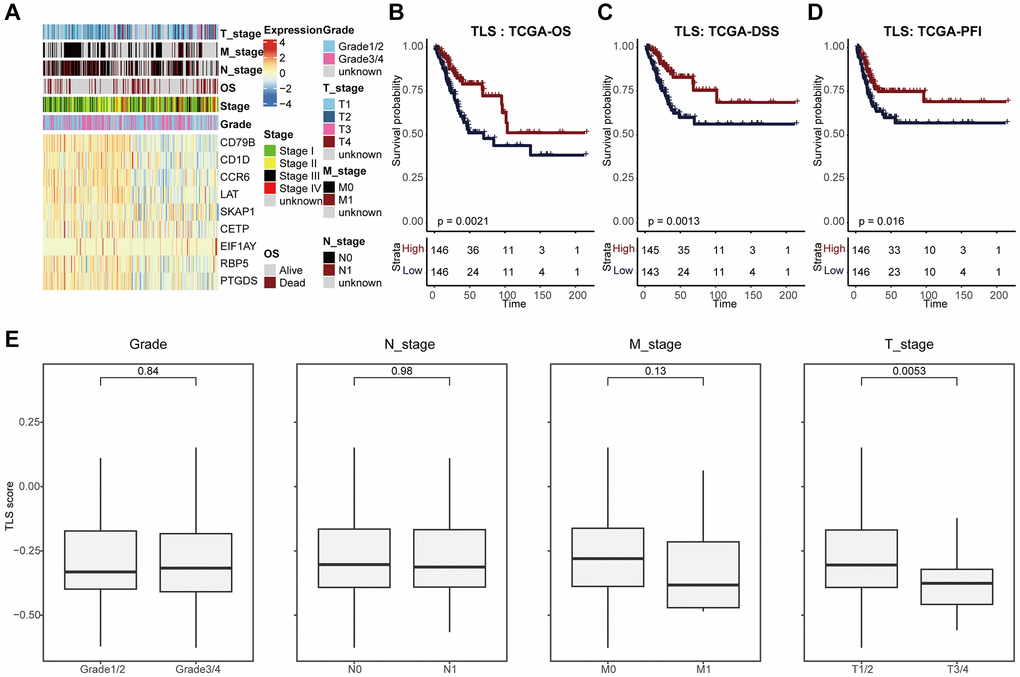
Figure 2.TLS was associated with favorable clinical outcome of CESC. (A) Heatmap showing the expression of nine TLS signatures in the TCGA-CESC cohort. (B–D) Kaplan-Meier curves showing the (B) OS-related, (C) DSS-related, (D) PFI-related predictive values of TLS in the TCGA-CESC cohort. Patients were divided into two groups based on the median value of TLS. (E) Comparing TLS among patients with different clinic-pathological characteristics.