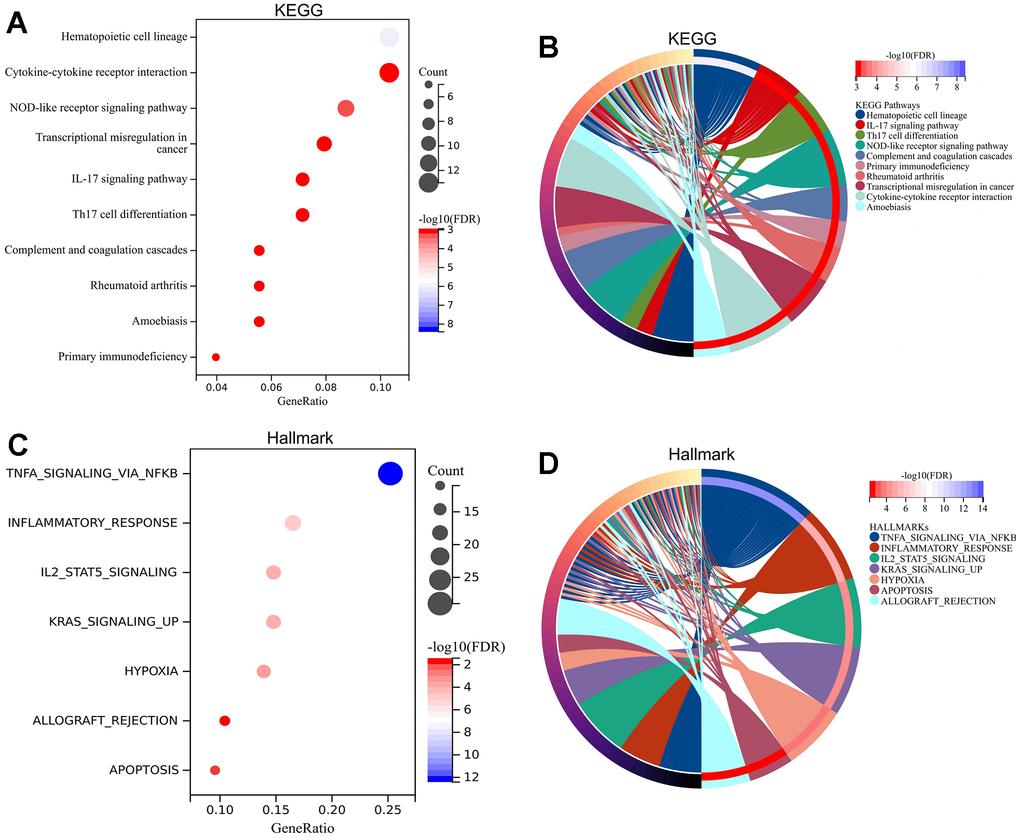
Figure 4.Enrichment analysis of pathways for DEGs. KEGG analysis for DEGs revealing significant pathways via bubble plot (A) and linked genes by cnetplot (B). Hallmark analysis for DEGs revealing significant pathways via bubble plot (C) and linked genes by cnetplot (D). Abbreviations: DEGs, differentially expressed gene; KEGG, Kyoto Encyclopedia of Genes and Genomes.