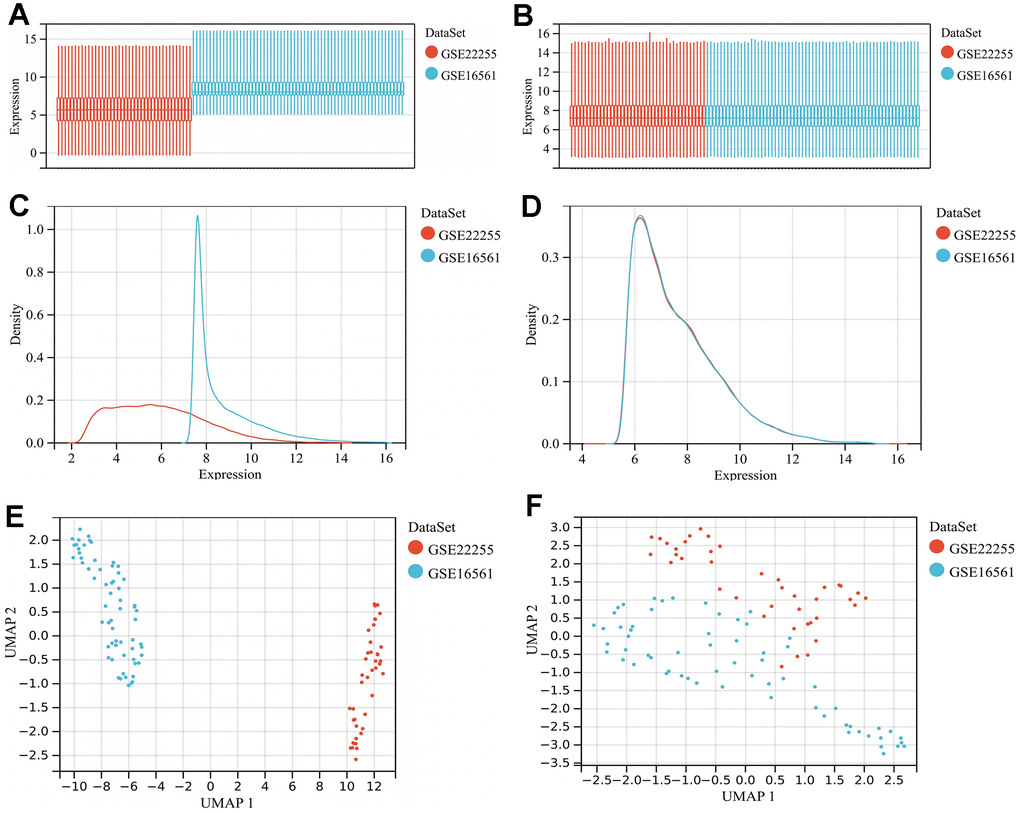
Figure 1.Merging of GSE16561 and GSE22255 datasets and batch effect removal. (A) Gene expression levels of the datasets before batch effect removal; (B) Gene expression levels of the merged dataset after batch effect removal; (C) Density plot of the datasets before batch effect removal; (D) Density plot of the merged dataset after batch effect removal; (E) UMAP plot of the datasets before batch effect removal; (F) UMAP plot of the merged dataset after batch effect removal. Abbreviations: UMAP, uniform manifold approximation and projection.