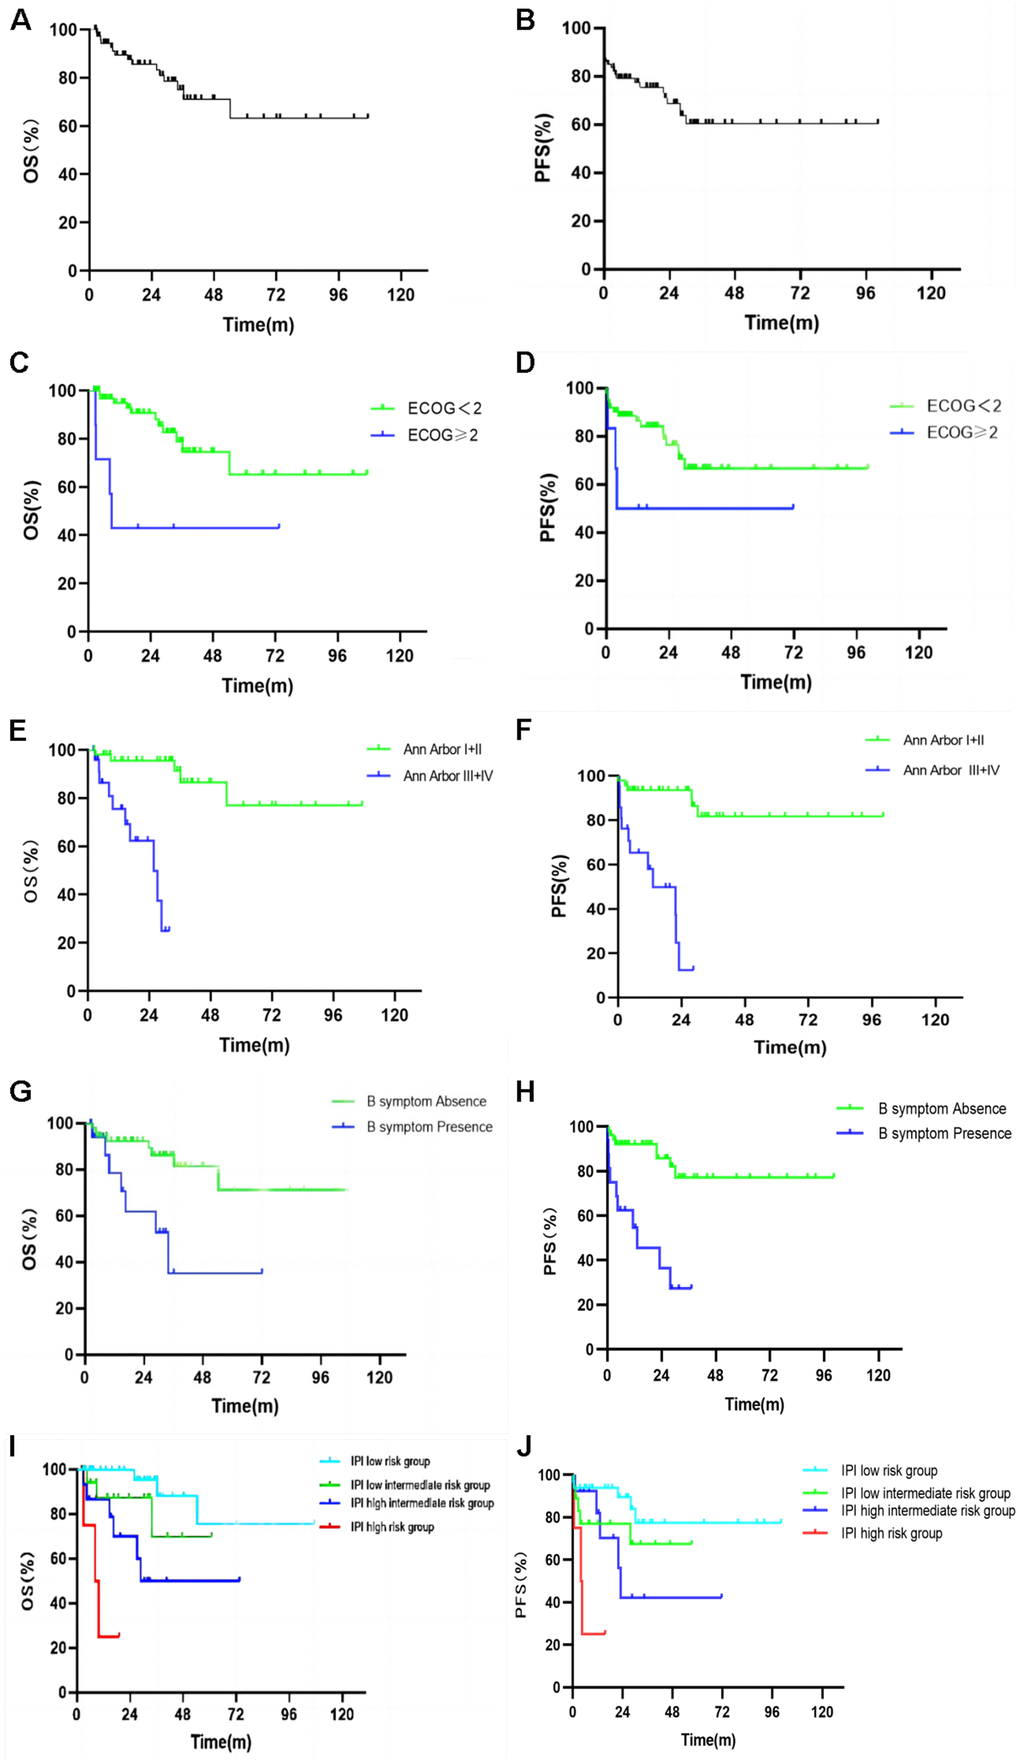
Figure 3.Kaplan Meier plots of the overall survival (A) and progression free survival (B) of all patients. Kaplan Meier plots of the overall survival and progression free survival by ECOG score (C, D), Ann Arbor stage (E, F), B symptoms (G, H), and IPI risk group stratification (I, J).