Submit an Article
Navigate
Home
Editorial Board
Editorial Policies
Current Volume
Archive
Scientific Integrity
Publication Ethics Statements
Interviews with Outstanding Authors
Newsroom
Sponsored Conferences
Podcast
Contact
Special Collections
Submit an Article
Online ISSN: 1945-4589
Research Paper
|
Volume 16
Classification patterns identification of immunogenic cell death-related genes in heart failure based on deep learning
Back to article
Figure 9
(9 of 13)
−
100%
+
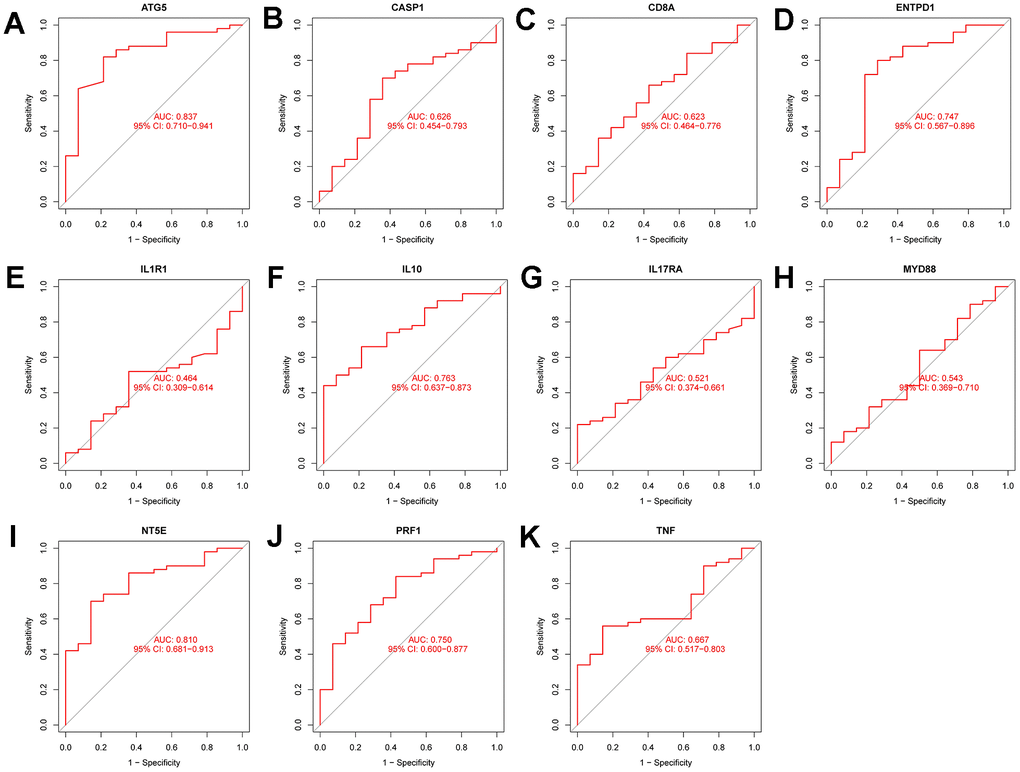
Figure 9.
Diagnostic performance verification of diagnostic genes and diagnostic models in the test set.
(
A
–
K
) are ROC curves of ATG5, CASP1, CD8A, ENTPD1, IL1R1, IL10, IL17RA, MYD88, NT5e, PRF1, and TNF in the test set, respectively.