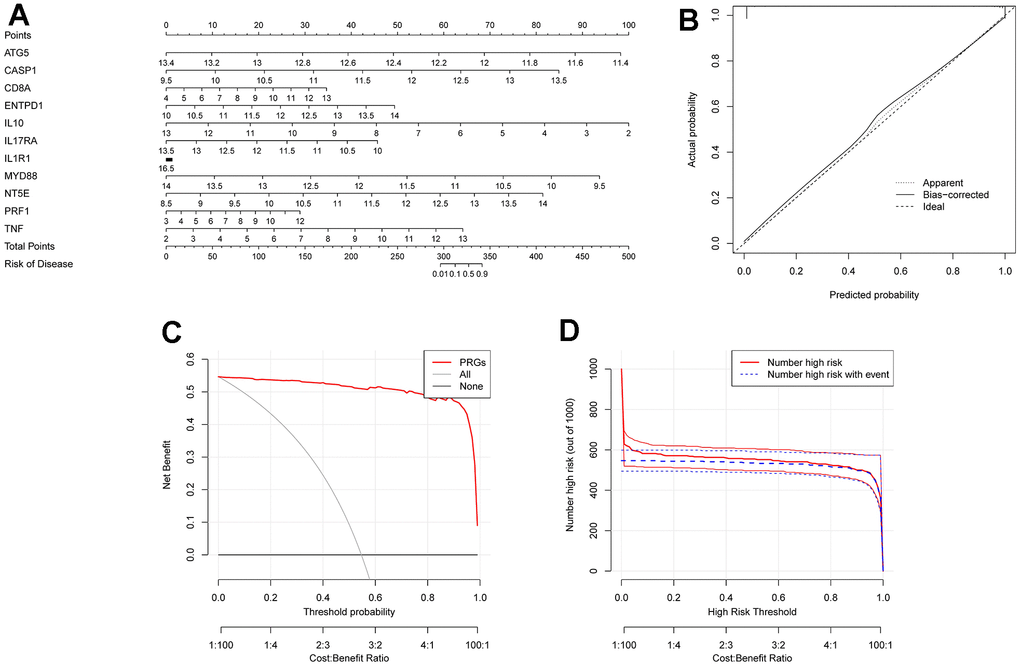
Figure 10.Construction of column diagram model. (A) is a nomogram model constructed on selected diagnostically-relevant genes (ATG5, CASP1, CD8A, ENTPD1, IL1R1, IL10, IL17RA, MYD88, NT5E, PRF1, and TNF). (B) is the calibration curve used to evaluate the diagnostic capability of the nomogram model. (C) is based on DCA, and the Nomogram model had higher clinical utility than a single diagnostically-relevant gene. (D) is the clinical impact curve.