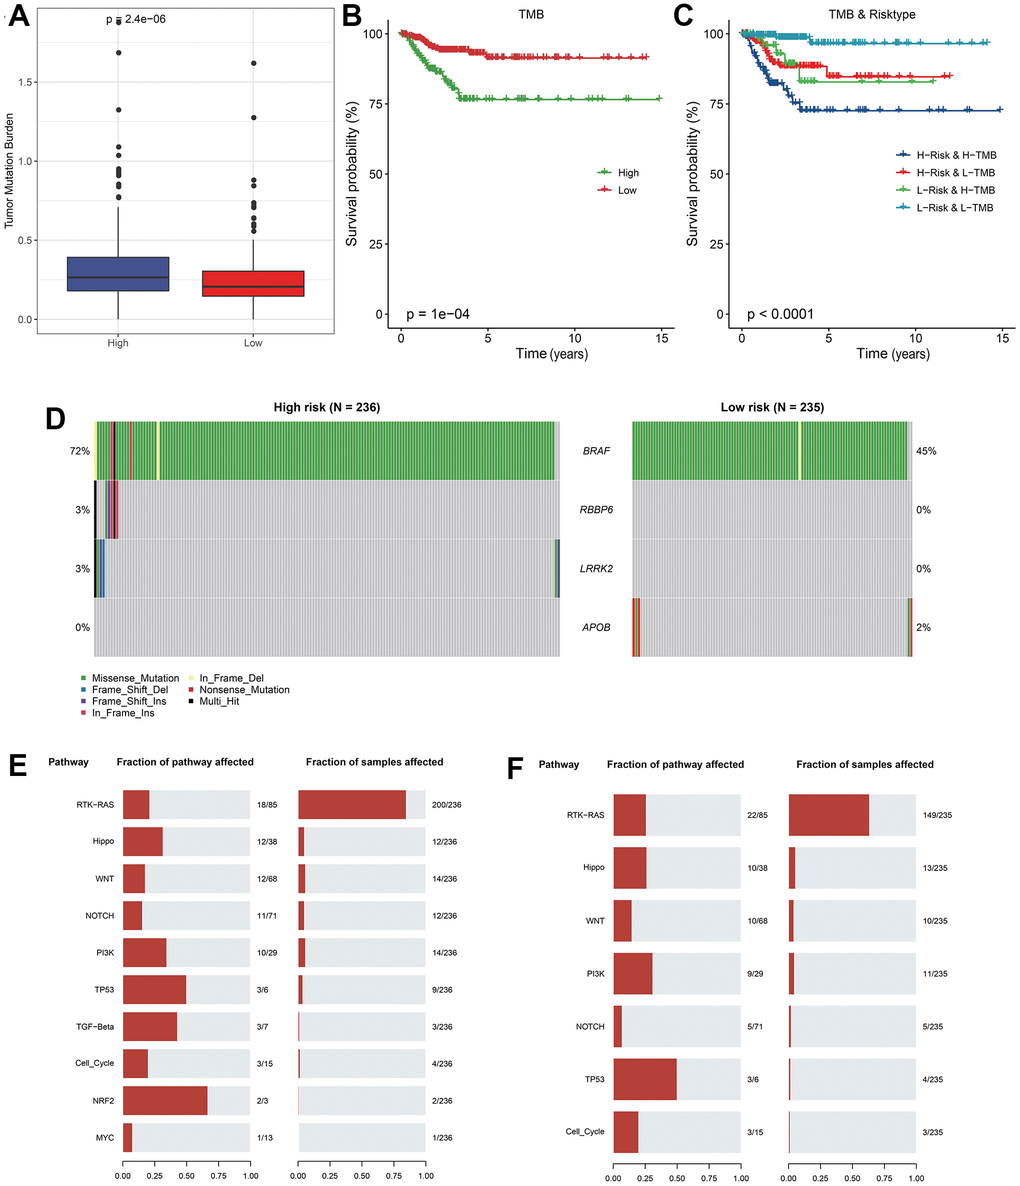
Figure 5.Analysis of mutation features between RiskScore groups. (A) TMB differences between RiskScore groups; (B) KM curve between high and low TMB groups in TCGA cohort; (C) KM curve of high and low TMB groups and high and low RiskScore of TCGA cohort; (D) Significantly different mutated genes between RiskScore groups; (E) Mutation frequency of tumor pathway genes and proportion of affected samples in the high RiskScore group; (F) Frequency of mutation of tumor pathway genes and proportion of affected samples in low RiskScore group.