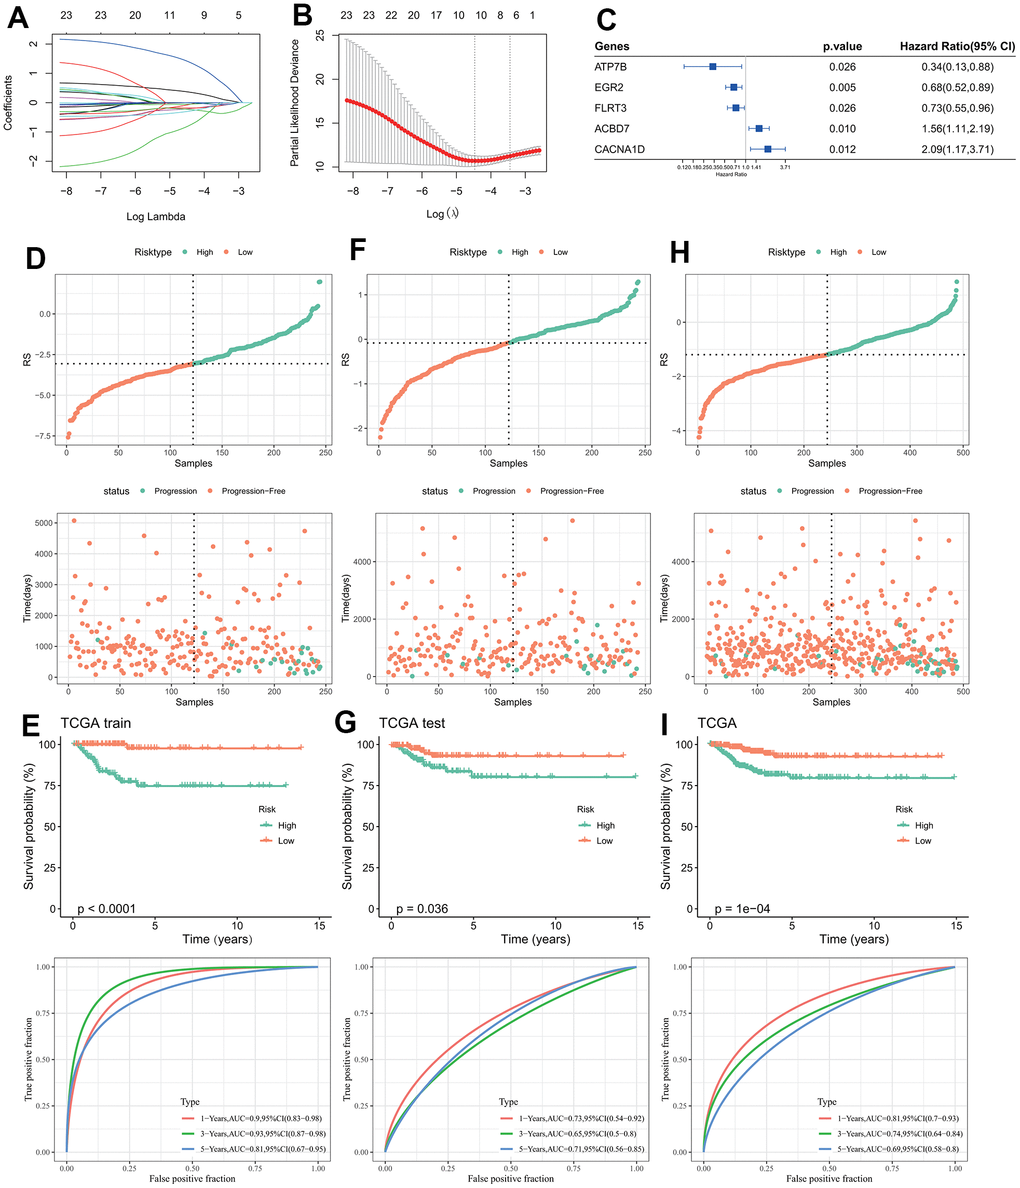
Figure 2.Design and validation of RiskScore model. (A) The trajectory of each independent variable changing with lambda; (B) Confidence interval under lambda; (C) Forest map of characteristic gene prognosis; (D, E) RiskScore of TCGA training set, ROC curve and KM curve of RiskScore model; (F, G) RiskScore of TCGA test set, ROC curve and KM curve of RiskScore model; (H, I) RiskScore of TCGA data set, ROC curve and KM curve of RiskScore of model.