Submit an Article
Navigate
Home
Editorial Board
Editorial Policies
Current Volume
Archive
Scientific Integrity
Publication Ethics Statements
Interviews with Outstanding Authors
Newsroom
Sponsored Conferences
Podcast
Contact
Special Collections
Submit an Article
Online ISSN: 1945-4589
Research Paper
|
Volume 16, Issue 3
|
pp. 2934–2952
Investigating the clinical role and prognostic value of genes related to insulin-like growth factor signaling pathway in thyroid cancer
Back to article
Figure 1
(1 of 6)
−
100%
+
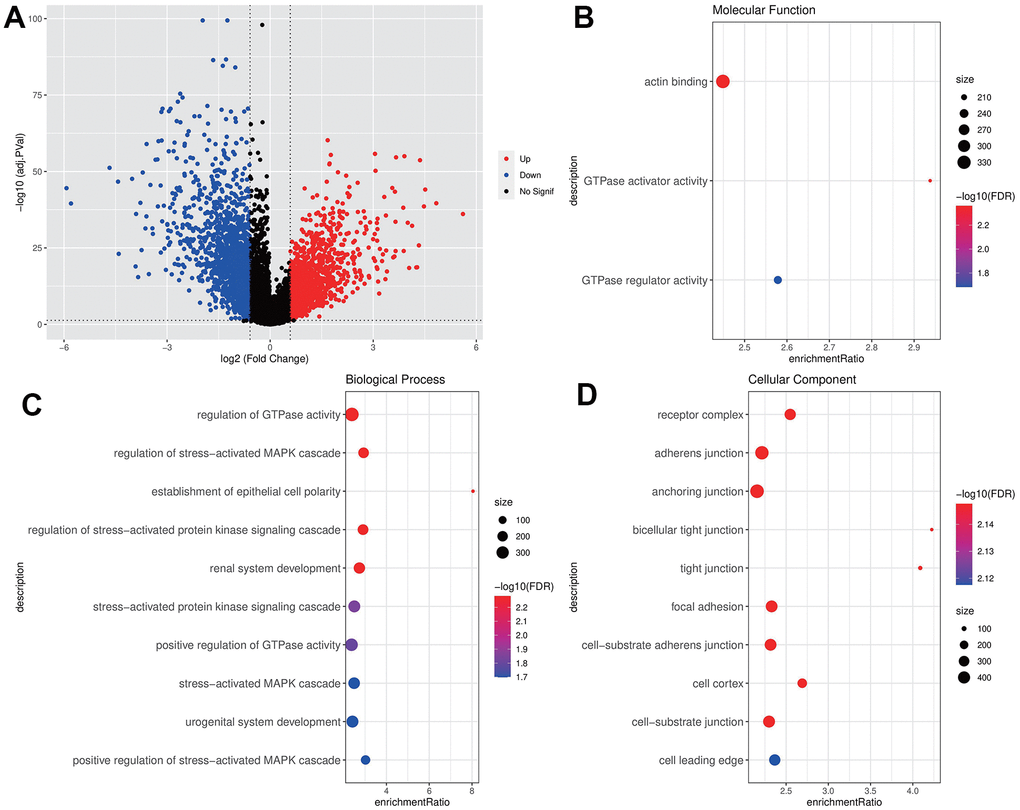
Figure 1.
Screening and enrichment of DEGs.
(
A
) DEGs volcano maps of THCA and normal samples in TCGA dataset; (
B
–
D
) GO enrichment analysis bubble chart of IGF score related DEGs (MF, BP, CC).